


Initial Memo: TSMC (TWSE:2330), 70% 5-Year Potential Upside (Fabian VERA, VIP)
Fabian presents a "Buy" based on its pivotal role in manufacturing cutting-edge chips, crucial for advancing Artificial Intelligence and High-Performance Computing worldwide.


LinkedIn | Fabian VERA
Valuation
Taiwan Semiconductor Manufacturing (TSMC) currently trades at ~FY2024 28.59x P/E, which is below to both the current industry average of 65x and the three-year industry average of 34.8x.
Given that TSMC current valuation is below average in the cyclical industry of semiconductor foundry, a fair assessment would lead to an IRR of 2-11%, and by the compounding effect of time, leading to a three-year target price of NT$976.72 and a five-year target price of NT$1,591.31.
As these high-floor prices are most likely to materialize due to Artificial Intelligence adoption and smartphone infiltration in society, it is right and just to dive into this rising tide that lifts all those technology boats.
Company overview
Established in 1987, TSMC was the world’s first dedicated semiconductor foundry. It was created to meet the growing demand for integrated circuits and to offer manufacturing services to other companies that design semiconductors but do not have their own fabrication facilities.
With Morris Chang at the helm as founder, TSMC grew rapidly and became a significant player in the global semiconductor market, which now operates a network of fabrication plants or foundries in Taiwan and has expanded its presence in the United States, China, Germany, and Japan. The company's headquarters and most of its R&D operations are based in Hsinchu, Taiwan. So much is the impact of this endeavor that you can find both Morris and his wife Sophie at the entry hall of MIT Sloan School of Management in Cambridge, Massachusetts, USA.

Fig. 1 – Picture of Morris and Sophie Chang at the entrance hall of MIT Sloan School of Management in Cambridge, Massachusetts, USA.
Industry Landscape
The semiconductor foundry industry plays a crucial role in the global technology supply chain, providing manufacturing services for semiconductor companies that design chips but do not have their own fabrication facilities.

Fig. 2 – Semiconductor Supply Chain, Center for Security and Emerging Technology, 2021 [1]
TSMC is the largest and most advanced semiconductor foundry in the world, commanding over 50% of the market share. Known for its cutting-edge technology, TSMC leads in advanced process nodes (e.g., 5nm, 7nm) and is a key supplier for major tech companies like Apple, AMD, and Nvidia.
By daring to sound too technical, I will defer engineering details of manufacturing process to the sterling study of Shan et al [1] available at the end of this memo. Meanwhile, Fig. 3 illustrates how the chips that powers your laptop, your phone, and chances are your favorite AI, come from nodes and wafers.

Fig. 3 – Chip Manufacturing Process, Center for Security and Emerging Technology, 2021 [1]
Framework to Analyze Semiconductor Foundries
To analyze Semiconductor Foundries effectively, three crucial variables should be considered: technological capability, production capacity and yield, and financial performance.
Technological capability.- Involves evaluating the range and advancement of process nodes, such as 3nm and 5nm, and the adoption of cutting-edge technologies like Extreme Ultraviolet (EUV) lithography. This also includes assessing the level of R&D investment to maintain technological leadership and reviewing the fab’s technology roadmap for future development.
Production capacity and yield.- Key for understanding a fab’s efficiency and scale with important metrics like wafer starts per month, which measure production scale, and the fab utilization rate, which indicates capacity usage. In addition, manufacturing yield rates defined as the percentage of functional chips per wafer, are crucial as higher yields translate into more efficient production processes and better overall efficiency.
Financial performance.- it provides insight into a fab’s economic stability and growth potential in the shape of revenue growth, profit margins, and focusing on contributions from different technology nodes. In particular, assessing the return on investment (ROI) for recent capital investments in new foundries or upgrades as well as evaluating the cost structure, including capital expenditures, operating expenses, and cost per wafer to determine financial health and competitiveness.
Using these three variables, Table 1 gathers both TSMC and its closest competitors, which leads us to our next section under the label of competitor analysis.
Table 1.- TSMC and close competitors under the aforementioned framework.

Competitor Analysis


Fig. 4 – Multiple Valuation plot of TSMC and its competitors, accompanied by stock performance.
The correlations suggest that industry-wide factors affect all players as the magnitude of growth varies significantly, with TSMC showing the most dramatic increase whereas Intel shows a notable recovery trend, possibly reflecting market optimism about its efforts to regain technological competitiveness, and both UMC and GlobalFoundries show more modest growth, reflecting their different market positions and focus areas compared to TSMC.
The lower part of Fig. 4 offers generate some observation points about TSMC-specific strengths and strategies that lead to significant differences in stock performance.
+Market Cap (Size of the circles): TSMC has the largest market capitalization among the companies shown, indicating that it's the most valuable company in this group.
+EV/EBITDA (Y-axis): TSMC has a higher EV/EBITDA multiple compared to most of its competitors. This suggests that investors are willing to pay a premium for TSMC's earnings, likely due to its market leadership and growth prospects.
+Free Cash Flow Yield (X-axis): TSMC's position shows a positive free cash flow yield, while some competitors like INTC (Intel) have negative yields. This indicates TSMC's strong cash generation ability relative to its market value.
+Positioning: TSMC is positioned in the upper right quadrant of the chart, which typically represents a favorable combination of growth (higher EV/EBITDA) and value (positive free cash flow yield).
+Competitors: Figure 4 includes other major players in the semiconductor industry:
INTC (Intel): Struggling with negative free cash flow yield
GFS (GlobalFoundries): Positioned close to TSMC but with lower multiples
SSNLF (Samsung): Lower EV/EBITDA multiple than TSMC
TSEM (Tower Semiconductor): Much smaller market cap and lower multiples
TSMC's position suggests it's "eating their lunch" by outperforming its competitors in terms of market valuation, cash flow generation, and overall financial health, which aligns with TSMC's known market leadership in advanced semiconductor manufacturing processes.
An accessory of this analysis would be to create a basket of tech stocks to see how well this competition performs against the S&P. On Figure 5 we see that such selection underperforms the benchmark by 16.12% which is a lot given that many funds pay bonuses when a portfolio beats a 15% hurdle rate.

Fig. 5 – Basket of TSCM and its competitors versus the S&P benchmark.
Business Model
Foundry Model: Unlike integrated device manufacturers (IDMs) like Intel, TSMC operates on a pure-play foundry model. This means it manufactures chips designed by other companies. This model allows it to serve a wide range of customers, including some of the biggest names in the tech industry. Its efficacy as foundry vis-à-vis its competitors has been discussed in the section ‘Competitor Analysis’.
Customers: TSMC’s clientele includes major technology companies such as Apple, Qualcomm, Nvidia, AMD, and many others. These companies rely on TSMC for their cutting-edge chip manufacturing capabilities. By serving its clients, the rhetorical question of “How effective is TSMC helping its clients?” deserves an answer


Fig. 6 – Multiple Valuation plot of TSMC and its clients, accompanied by stock performance
From Figure 6, TSMC is helping its clients in a manner that could be described as "a rising tide that lifts all boats” under the following lenses:
Overall Trend: All the companies shown (TSMC, Apple, Qualcomm, and AMD) have seen significant growth over the period displayed, with their stock prices trending upwards.
Correlation: The stock price movements of these companies are generally correlated, suggesting that they benefit from similar market conditions and technological advancements.
TSMC's Performance: TSMC (shown in black) has a strong performance, growing from around 50% to over 100% during the period. As the primary manufacturer for the other companies' chips, TSMC's success likely contributes to their performance.
Client Performance:
+ AMD (purple) shows the most dramatic growth, outperforming the others.
+ Apple (blue) and Qualcomm (yellow) also show steady growth, closely tracking TSMC's performance.
Interdependence: The similar growth patterns suggest a symbiotic relationship. TSMC's advanced manufacturing capabilities enable its clients to produce cutting-edge products, while the clients' demand drives TSMC's growth.
Semiconductor Ecosystem: The chart illustrates the interconnected nature of the semiconductor industry, where the success of the foundry (TSMC) and its clients (chip designers) are closely linked.
The lower part of Figure 6 offers an insight on valuation benchmarks of TSMC and its clients:
+The fact that these major tech companies are represented alongside TSMC indicates the crucial role the latter plays in its client’ supply chains. By manufacturing chips for its clients, TSMC enables them to focus on chip design while relying on TSMC's expertise and advanced manufacturing processes for production.
By manufacturing their chips, it maintains a position as a pure-play foundry and by consequent it doesn't compete with its customers by designing its own chips, allowing TSMC to serve a wide range of clients without conflict of interest. Curiously, Figure 6 shows Tesla (TSLA), which, while not typically considered a direct client of TSMC for chip manufacturing, is a major consumer of semiconductors for its electric vehicles and may indirectly benefit from TSMC's services through its suppliers.
For the sake of consistency, Figure 6 shows a basket of these stocks in two scenarios, with and without Nvidia, as this client has been captivating most of the financial commentary in recent weeks.
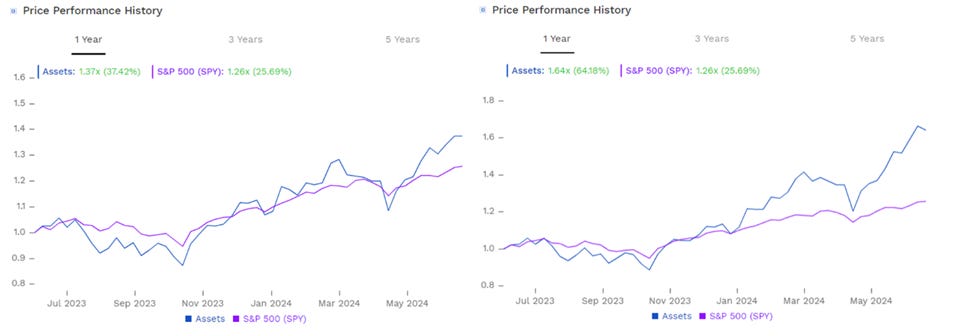
Fig. 7 – Stock Portfolio with Nvidia (right) and without (left) versus the S&P benchmark
Both portfolios generate alpha. Without Nvidia you get a decent alpha of 11.73%, enough to overcome any hurdle rate of 10% by a margin of 173 basis points on the left. With Nvidia you create an alpha of 38.49%, good for any ambitious hurdle rate above 20 percent.
Revenue Drivers

Table 2- Six industries of service signal diversification of revenue streams. 2023 TSMC SEC Filings.
On Table 2 we appreciate a decrease in net revenue from 2022 to 2023 mainly came from Smartphone of NT$73,965 million (8% year-over-year decrease), and from Internet of Things of NT$34,198 million (17% year-over-year decrease). The decrease was partially offset by an increase from Automotive of NT$17,273 million (15% year-over-year increase).
Such increase in net revenue from 2021 to 2022 came mainly from High Performance Computing of NT$344,604 million (59% year-over-year increase), and from Smartphone of NT$193,788 million (28% year-over-year increase). This increase also came from Internet of Things of NT$63,109 million (47% year-over-year increase)

Table 3.- Revenue per nanometer resolution highlights rewards by innovation. 2023 TSMC SEC Filings.
In 2023, the 3-nanometer, 5-nanometer and 7-nanometer revenues represented 6%, 33% and 19% of total wafer revenue, respectively. Advanced technologies (7-nanometer and below) accounted for 58% of total wafer revenue, up from 53% in 2022. In 2022, the 5-nanometer and 7-nanometer revenues represented 26% and 27% of total wafer revenue, respectively. Advanced technologies (7-nanometer and below) accounted for 53% of total wafer revenue, up from 50% in 2021. Consolidated numbers are available on table 3, courtesy of 2023 TSMC SEC Filings, and unit economics are available on full display in [2].
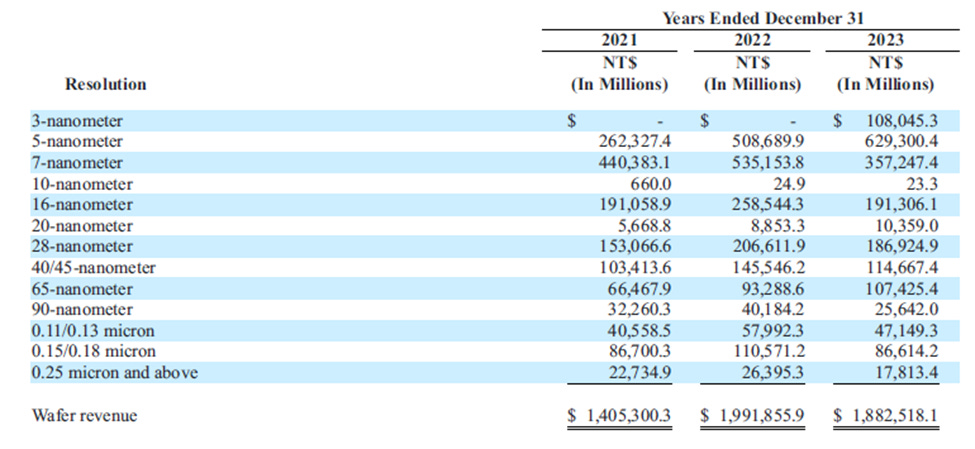
Table 4.- Revenue per nanometer resolution in NT$ for 2021, 2022, and 2023. 2023 TSMC SEC Filings.
Cost drivers
Cost drivers is a combination of Transistor Density, Design, Energy, Assembly, Test, and Packaging Cost.
Transistor density.- Defined as the amount of chips a wafer can create at once from Fig. 2. A 300 mm diameter silicon wafer produces 71.4 chips of 610 mm2 GPUs on average, which is the chip OpenAI used in 2018 to train the breakthrough AI algorithm OpenAI Five for reference.
Design.- Annual growth rates in the cost of semiconductor fabrication facilities (eleven percent) and design costs per chip (24 percent) are faster than those of the semiconductor market (seven percent)[3]. And the approximate number of semiconductor R&D workers has been increasing seven percent per year. Costs of photolithography tools, the most expensive and complex segment of semiconductor manufacturing equipment (SME), have risen from $450,000 per unit in 1979 to $123 million in 2019 [4] And only one photolithography company, ASML in the Netherlands, now sells photolithography equipment capable of manufacturing the smallest 5 nm transistors.
Energy.- The chip we are discussing at Transistor Density has an estimated electricity cost of $0.07625 per kilowatt-hour to determine chip annual energy usage[5] We increase the energy costs by 11 percent to account for cooling and other costs based on Google’s report that its data centers have an average power usage effectiveness (PUE) of 1.11 [6]
Assembly, Packaging Costs.- A decrease in wafer shipment can inflict a damage of 4.5% in revenue. Table 5 shows how shipping approximately 12 million 12-inch equivalent wafers in 2023 compared to 15.3 million in 2022 is partially offset by an increase in average selling prices (ASP) due to a higher proportion of advanced technology (7-nanometer and below) revenue and a depreciation of the NT dollar against the U.S. dollar.

Table 5.- Shipment impact on revenue. 2023 TSMC SEC Filings [10].
For reference purposes, outsourced semiconductor assembly and test (OSAT) firm costs can be obtained on the ratio of the foundry market to the assembly, test, and packaging (ATP) market [7]
Economic moat
The '7 Powers' framework by Hamilton Helmer provides a methodology for analyzing the enduring competitive advantages of companies. The powers identified in this framework are Scale Economics, Switching Costs, Cornered Resources, Counter Positioning, Branding, Network Effects, and Process Power [8]. Applying this framework to TSMC offers insights into the company's strategic position within its industry.
Scale Economies.- TSMC benefits significantly from scale economies. As the world's largest dedicated semiconductor foundry, it can spread its massive fixed costs (R&D, capital equipment) over a larger production volume, reducing per-unit costs. TSMC scale allows it to invest more in advanced technologies and capacity, further reinforcing its leadership position.
Network Economies.- TSMC has strong network effects in its ecosystem. As more customers use TSMC's services, the company can invest more in advanced processes, attracting even more customers. The extensive network of partners, suppliers, and customers creates a robust ecosystem that's difficult for competitors to replicate.
Counter-Positioning.- TSMC's pure-play foundry model is a form of counter-positioning against integrated device manufacturers (IDMs) like Intel. By not competing with its customers in chip design, TSMC avoids conflicts of interest and can serve a broader customer base.
Switching Costs.- Once a customer designs a chip for TSMC's process, switching to another foundry is costly and time-consuming. The deep integration of TSMC's manufacturing processes with customers' design processes creates high switching costs.
Branding.- While not a consumer-facing brand, TSMC has a strong reputation in the industry for reliability, quality, and technological leadership. This "industrial branding" helps TSMC maintain customer loyalty and attract new business.
Cornered Resources.- TSMC's accumulated knowledge and expertise in advanced semiconductor manufacturing is a cornered resource. Its pool of highly skilled engineers and scientists, along with proprietary manufacturing processes, are difficult for competitors to replicate.
Process Power.- TSMC excels in process power through its continuous improvement in manufacturing techniques and its ability to quickly ramp up production of new process nodes. The company's efficient and effective management of the complex semiconductor manufacturing process gives it a significant edge over competitors.
As TSMC has built substantial moats through its strategic initiatives in Scale Economies, Network Economies, and Process Power with graphical representation in both Figure 4 and 6, there could be potential weaknesses or challenges in maintaining or enhancing these moats over time. Let's delve into each power and identify possible weaknesses:
TSMC's scale economies face challenges due to high capital expenditure requirements, risk of overcapacity, and potential inefficiencies in large organizations.
The company's network economies are vulnerable to overdependence on key customers, geopolitical tensions disrupting global networks, and potential innovation slowdowns due to ecosystem lock-in.
TSMC's counter-positioning strategy may weaken as competitors enter the foundry business, and its pure-play model could limit opportunities in vertically integrated markets.
Switching costs, while beneficial for TSMC, may face resistance from customers wary of deep integration, and could be reduced by technological breakthroughs or government interventions.
TSMC's branding faces challenges due to its invisibility to end consumers, vulnerability to reputation damage, and difficulty in differentiating in a technical B2B market.
The company's cornered resources are at risk from talent poaching, knowledge diffusion, and potential obsolescence due to disruptive technologies.
TSMC's process power is challenged by the increasing complexity and cost of advancing to smaller nodes, physical limits of silicon-based semiconductors, and the potential for competitors to achieve breakthrough innovations.
Overall, TSMC faces vulnerabilities from the cyclical nature of the semiconductor industry, geopolitical risks related to Taiwan, concentration of manufacturing in an earthquake-prone region, Moore’s Law, and potential competition from government-backed rivals.
Overvalued or Undervalued?
To determine whether TSMC is overvalued or undervalued, we'll need to consider multiple valuation methods. Figure 4 and 6 already shows multiples valuation plots done for us so let’s dive into previous transactions and discounted cashflows.
Previous Transactions.- In the semiconductor industry, acquisitions often happen at significant premiums with recent deals in the chip sector have seen multiples of 20-30x earnings with a mean of 24.7x [9]. Compared to these transactions, TSMC is undervalued.

Fig. 8 – Previous transactions and its valuations in the semiconductor foundry industry in 2023
Discounted Cash Flow (DCF): A DCF analysis shown on Figure 9 considers TSMC's future cash flows, growth rate, and cost of capital. Accessory calculations of WACC, price projections, and dynamic model upon request.

Fig. 9 – Discounted Cash Flow for TSMC, courtesy of its financial reports at end of fiscal year 2023.
An analysis from Figure 9 helps to understand its financial health given the nature of its cyclical industry, delivering an IRR from 2-11%, and by the compounding effect of time, leading to a three-year target price of NT$976.72 and a five-year target price of NT$1,591.31.
Based on these methods, TSMC is either fairly valued or slightly undervalued. Tangibles like strong market position, technological leadership, and growth prospects support its current valuation. Multiples suggest it's reasonably priced compared to peers, while DCF models tend to indicate potential upside in the short- and long-term.
Conclusion
TSMC stands as a dominant force in the semiconductor foundry industry, buoying all tech companies in its wake. This competitive positioning allows TSMC to serve as a powerful ally for clients aiming to drive revenue.
TSMC exemplifies strategic prowess through the 7 Powers framework in the form of Scale Economies, Network Economies, and Process Power, while also embracing diversification to stay resilient amid industry shifts.
I recommend that investors buy TSMC stock for the long term for its pivotal role in manufacturing cutting-edge chips, crucial for advancing Artificial Intelligence and High-Performance Computing worldwide.
Disclaimer
The information provided herein concerning Taiwan Semiconductor Manufacturing, TSMC, is for informational purposes only and is not intended to be, nor should it be construed or used as financial, legal, tax, or investment advice, nor should this information be used or considered as an offer to sell, or a solicitation of any offer to buy, any security or other financial instrument related to TSMC. Past performance of TSMC is not indicative of future results. Investments or strategies mentioned herein may not be suitable for all investors. The views and opinions expressed herein are those of the author and do not necessarily reflect the views of TSMC, its management, or any other individual or entity. It is recommended that investors independently research and consider the risks involved before investing in TSMC securities and consult with appropriate tax, legal, and/or financial advisors. Invest responsibly. Your discretion is advised.
Do note that all of this is for information only and should not be taken as investment advice. If you should choose to invest in any of the stocks, you do so at your own risk.
References
[1] Saif M. Khan, Alexander Mann, and Dahlia Peterson, "The Semiconductor Supply Chain: Assessing National Competitiveness" (Center for Security and Emerging Technology, January 2021). https://doi.org/10.51593/20190016
[2] Saif M. Khan and Alexander Mann, "AI Chips: What They Are and Why They Matter" (Center for Security and Emerging Technology, April 2020), cset.georgetown.edu/research/ai-chips-what-they-are-and-why-they-matter/. https://doi.org/10.51593/20190014
[3] Semiconductor Industry Association, “2019 Factbook,” May 20, 2019 https://www.semiconductors.org/the-2019-sia-factbook-your-top-source-for-semiconductor-industry-data/
[4] “Semiconductor Wafer Mask Costs,” anysilicon, September 15, 2016 https://anysilicon.com/semiconductor-wafer-mask-costs/
[5] In October 2019, U.S. industrial users paid an average of $0.0685 per kilowatt-hour with a regional range between $0.0550 and $0.2306 per kilowatt-hour. “Electric Power Monthly,” U.S. Energy Information Administration, December 23, 2019, https://www.eia.gov/electricity/monthly/epm_table_grapher.php?t=epmt_5_6_a. Chinese industrial users pay an average of $0.084 per kilowatt-hour. Zoey Ye Zhang, “China Electricity Prices for Industrial Consumers,” China Briefing, April 23, 2019, https://www.china-briefing.com/news/china-electricity-prices-industrial-consumers/. This report uses the average of these values: $0.07625 per kilowatt-hour.
[6] “Efficiency,” Google Data Centers, accessed January 4, 2020, https://www.google.com/about/datacenters/efficiency/
[7] OECD, Measuring distortions in international markets: The semiconductor value chain (Paris, France: OECD Trade Policy Papers, No. 234, OECD Publishing, December 12, 2019), 22, http://dx.doi.org/10.1787/8fe4491d-en.
[8] 7 Powers: The Foundations of Business Strategy, https://blas.com/7-powers/#:~:text=7%20Powers%3A%20The%20Foundations%20of,is%20written%20by%20Blas%20Moros
[9] Industry Insight: Semiconductor Sector Report 2023. https://www.arthos.de/fileadmin/template/public/pdf/arthos-semiconductor-12-2023.pdf
[10] 2023 TSMC SEC Filings. https://investor.tsmc.com/sites/ir/sec-filings/2023%2020F.pdf