


Initial Memo: Waste Management, Inc. (NYSE:WM), 20% 5-Year Potential Upside (Nicholas TAN, EIP)
Nicholas suggests a "Buy" for Waste Management Inc, with DCF-based target prices of $238.33 (3Y) and $269.84 (5Y). WM outperforms peers in ESG, boasting higher ratings from multiple agencies.


Executive Summary

LinkedIn | Nicholas TAN
NYSE:WM Against NYSE Composite Index

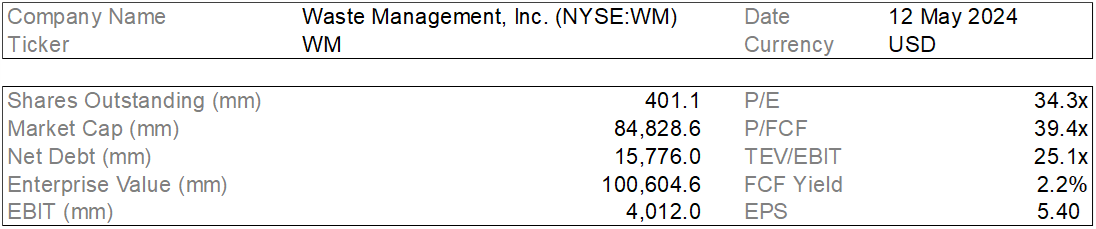
Key Financial Information

Company Overview
Waste Management, Inc. (WM) is a leading provider of environmental solutions headquartered in Houston, Texas. Established in 1971, the company operates a comprehensive suite of services, including collection, transfer, recycling, and disposal services to millions of residential, commercial, industrial and municipal customers throughout the U.S. and Canada.
WM maintains the most extensive disposal network and collection fleet in North America. It is also the largest recycler of post-consumer materials and is the leader in the beneficial use of landfill gas, with a growing network of renewable natural gas plants and the most landfill gas-to-electricity plants in North America. WM's fleet encompasses more than 12,000 natural gas trucks, making it the largest heavy-duty natural gas truck fleet of its kind in North America.

Business Segment
WM operates through 4 major business segments: (a) Collection and Disposal (b) Recycling Processing and Sales, (c) WM Renewable Energy and (d) Corporate & Others.
Collection and Disposal
The Company evaluates its Collection and Disposal businesses primarily through two geographic segments: East Tier and West Tier. Its East Tier primarily consists of geographic areas located in the Eastern U.S., the Great Lakes region and substantially all of Canada. The West Tier includes geographic areas located in the Western U.S., including the upper Midwest region, and British Columbia, Canada. It also provides ancillary services. These 2 geographical segments offer integrated environmental services, including:
Collection Services
Collection encompasses picking up and transporting waste and recyclable materials from the source where it was generated to a transfer station, material recovery facility (“MRF”) or disposal site. WM offers collection services for residential, commercial, industrial, and other collections.
Transfer & Disposal Services
WM operates transfer stations where collected waste is consolidated and compacted (to reduce the volume and increase the density of the waste) before being transported by transfer trucks or by rail to disposal facilities such as landfills or waste-to-energy plants. These services ensure efficient and environmentally responsible disposal of waste materials. As of December 31, 2022, the company owned or operated 332 transfer stations in the U.S. and Canada.
Landfill Operation
Landfills serve as the main depositories for solid waste in North America. As of December 31, 2022, WM owned or operated 263 solid waste landfills and five secure hazardous waste landfills, which represent the largest network of landfills throughout the U.S. and Canada. These facilities are designed and managed to meet strict regulatory standards for waste disposal while maximising the recovery of energy and resources from waste streams.
Recycling Processing and Sales
WM’s Recycling Processing and Sales segment encompasses the extraction of reusable materials from the waste stream for processing and resale or other disposition. As North America’s leading recycler of post-consumer materials, the company operates recycling facilities where collected recyclables are sorted, processed and sold for reuse to manufacturers. Some of its recycling operations include:
Materials processing
Through its collection operations and third-party customer base, WM collects recyclable materials from residential, commercial and industrial waste materials and transfers these materials to one of our MRFs for processing. As of December 31, 2022, the Company maintains 97 MRFs, of which 46 are single stream, where cardboard, paper, glass, metals, plastics, construction and demolition materials and other recycling commodities are recovered for resale or rechanneled for other purposes.
Recycling commodities
WM also engages in global marketing and resale of recycling commodities. The Company oversees the marketing of these recycling commodities, which are processed in their facilities, by maintaining comprehensive service centres that continuously analyse market prices, logistics, market demands and product quality.
Recycling brokerage services
The Company also offers recycling brokerage services, which entails managing the marketing of recyclable materials for external parties. WM’s proficiency in processing recycling commodities for its operations imparts it with the necessary expertise to efficiently manage volumes for third parties. Leveraging the resources and expertise of its recycling operations' service centres, Waste Management can support its customers in marketing and selling their recycling commodities with minimal capital requirements.
WM Renewable Energy
Through its WM Renewable Energy segment, WM develops, operates and promotes projects for the beneficial use of landfill gas. The methane component of landfill gas is a readily available, renewable energy source that can be gathered and used beneficially as an alternative to fossil fuel. Through its methane gas capture systems for energy generation, WM can produce commercial quantities of methane gas at owned or operated landfills via 135 landfill gas beneficial use projects.
Corporate & Others
Other than traditional waste management services, WM offers environmental consulting and remediation services that focus on assisting clients in managing environmental risks, complying with regulations, and implementing sustainable practices. This includes:
Sustainability and Environmental Solutions (“SES”)
Waste Management's Sustainable Environmental Solutions (SES) business provides a suite of services to customers through collaboration with its Areas and strategic accounts programs. These services include construction and remediation services, assistance with the disposal of fly ash and other fuel residues, and in-plant services where WM employees work within customers' facilities to offer comprehensive waste management solutions and consulting. WM's vertically integrated waste management operations enable it to provide customers with comprehensive environmental solutions. With its extensive service offerings, expertise in waste management practices, and utilisation of technology, WM is equipped to support its customers in minimising waste generation, identifying recycling opportunities, and establishing efficient and environmentally friendly waste collection and disposal methods. Through these services, Waste Management aims to support customers in increasing circularity and advancing their decarbonization objectives.
Strategic Business Solutions (“WMSBS”)
While many waste management services typically operate on a local scale, WM's Waste Management Services for Business (WMSBS) business caters to customers with operations across the United States and Canada. Through its strategic accounts program, the business provides customers with streamlined services, improved reporting capabilities, measurement tools focused on achieving sustainability goals, and centralised billing and account management.
Expanded Service Offerings and Solutions
In addition, WM offers a range of extended service options and solutions beyond the scope of its Solid Waste business. This includes the collection of project waste, such as construction debris and household or yard waste, facilitated through its Bagster business.
Detailed Revenue Breakdown - Line of Business

In Fiscal Year 2023, WM generated a total revenue of $20,426 million. A detailed breakdown of WM’s net operating revenue in FY2023 is shown on the left.
70.28% of its FY2023 revenue was derived from WM’s Collection Services, 15.92% from Landfill Operations, 6.15% from Transfer & Disposal Services, 6.19% from Recycling Processing and Sales, 1.34% from WM Renewable Energy and 0.12% from Corporate and Other.
Cost Drivers
WM’s operating expense in 2023 is reported at 12,606 million or 61.7% of revenue, compared to 12,294 million in 2022 or 62.4% of revenue in 2022. The increase in operating expenses is mainly attributed to:
Maintenance, Repairs and Subcontractor Cost
Maintenance and repair expenses for vehicles, machinery, and processing equipment are key factors of WM’s overall expenditures. Inflationary cost pressure for these operational assets is expected to drive costs for WM in the future.
Furthermore, costs associated with landfill operations, including fees for waste disposal, maintenance, and environmental monitoring, are also significant drivers of WM’s expenses. These expenses are integral to maintaining compliance with regulatory standards, ensuring environmental sustainability, and managing waste effectively. With increasingly stringent regulatory standards globally, regulatory costs are expected to increase for WM.
Fuel Prices
Given the extensive fleet of vehicles used for waste collection and transportation, fluctuations in fuel prices can have a substantial effect on the company's operational costs, particularly for its commodity-driven business.
Labour Cost
The wages and benefits paid to employees involved in waste collection, sorting, disposal, recycling and administrative functions represent a substantial portion of WM’s operational expenditures. As labour unions are expected to continue organising employees for collective bargaining agreements, adjustments in wages for WM employees are anticipated to impact the Company's labour costs.
Sustainability & ESG Considerations
Sustainability Strategy & Targets
WM’s sustainability strategy is centred on three core ambitions:
Material is repurposed
Under this ambition, the Company seeks to reimage a circular economy. WM strives to operate innovative recycling and waste solutions that help fuel the continuous reuse of materials. Using 2021 as a baseline, WM sets a target to increase the recovery of materials by 60% to 25 million tons per year by 2030, including an interim milestone of a 25% increase by 2025.
Energy is renewable
Under this ambition, WM aims to innovate for climate progress. The Company leverages advanced technologies to turn waste into energy that powers communities and reduces GHG emissions. It aims to reduce absolute Scope 1 and 2 GHG emissions to 42% by 2031 (science-based target) and target beneficial use of 65% of captured landfill gas by 2026.
Communities are thriving
Under this ambition, WM focuses on empowering people to live sustainably. It collaborates to strengthen the resilience of the diverse places where we live and work. This includes increasing the representation of communities WM serve by increasing female representation from frontline to leadership roles and minority representation in manager and above roles. The Company also aims to reduce the Total Recordable Incident Rate (TRIR) by 3% annually, targeting 2.0 by 2030 and continue to focus on prevention of serious injuries. Moreover, WM strives to drive positive social impact for 10 million people in their communities through targeted social impact programs by 2030.
Sustainability Achievements
WM's commitment to sustainability is manifested by its numerous accolades and recognitions. The Company has consistently earned prestigious awards, underscoring its commitment to environmental responsibility and ethical business practices. WM was named one of America’s Most Responsible Companies by Newsweek for four consecutive years. Additionally, it received recognition as one of the World’s Most Ethical Companies by Ethisphere from 2008 to 2023, showcasing its steadfast adherence to ethical standards. Furthermore, WM was recognized to be among the 100 Best Corporate Citizens by Corporate Social Responsibility Magazine, 3BL Media, spanning from 2015 to 2022, highlighting its dedication to corporate social responsibility. Moreover, the company is on CDP's “A” list for Climate Change from 2016 to 2020, which underscores its proactive efforts in combating climate change. These accolades serve as a testament to WM's unwavering commitment to sustainability and environmental stewardship.
Management Analysis
President & CEO
Mr James C. Fish Jr. currently serves as the president and chief executive officer for WM. He is also a member of the Board of Directors.
Mr. Fish's tenure at WM spans over 2 decades, during which he has held several key positions within the company. Notably, he served as the CFO in 2012, before his promotion to the role of President in July 2016. Prior to these executive roles, Mr. Fish held several significant positions within WM, showcasing his depth of experience and expertise in the waste management industry.
Prior to his role as CFO, Mr. Fish held positions of increasing responsibility within the company. He served as the Senior Vice President for WM's Eastern Group, overseeing operations in a crucial region for the company's business. Additionally, he held the position of Area Vice President for Pennsylvania and West Virginia, demonstrating his leadership capabilities in managing operations across multiple states.
Mr. Fish's extensive experience and track record make him a highly capable leader for WM. His strategic vision, financial acumen, and operational expertise have been instrumental in driving the company's growth and success. As President and CEO, Mr. Fish is expected to lead WM with a focus on innovation, sustainability, and delivering value to shareholders.
Other Key Executives
The average tenure of the key executives is 3.1 years. The WM’s executive team are shown below:

Alignment - Inside Ownership
The directors and currently serving executive officers collectively owned 711,977 shares of common stock, constituting approximately 0.2% of inside ownership. This insider ownership underscores the alignment of interests between directors and members of the management team and confidence in WM. A breakdown of ownership is shown below:

Alignment - Executive Compensation
WM’s executive compensation program encompasses 4 elements: (a) Base Salary, (b) Short-term Performance Incentives - Annual Cash Incentive, (c) Long-Term Performance Incentives - Performance Share Units, (d) Long-term Incentives - Stock Options and (e) Long-term incentives - Restricted Stock Units.

Currently, 72% of the total compensation of WM's President and Chief Executive Officer was linked to long-term equity awards, and a majority of the total compensation of other named executives, on average, was tied to long-term equity awards, which aligns executives’ interests with those of stockholders.
Accountability - Executive Compensation Structure
The MD&C Committee employs compensation data from comparison groups of companies to remain competitive, ensuring the attraction and retention of key talent. This information is sourced from:
Size-adjusted median compensation data from two general industry surveys in which management annually participates; the Aon Hewitt 2020 Total Compensation Measurement Survey and the Willis Towers Watson 2021 Executive Compensation Database Survey.
Median compensation data from a comparison group of 20 publicly traded U.S. companies are described below.

The following metrics are also utilised to determine WM executive compensation benefits

Industry Analysis
WM mainly operates in two main markets: (a) Canada and (b) the United States of America (U.S).
Canada Market Size & Structure
The Canadian waste management market size was valued at USD$34.5 billion in 2023 and is expected to grow to USD 49.16 billion by 2023, with a CAGR of 5.2% from 2024 to 2030. This market growth is driven partly by rising demand for eco-friendly waste management solutions as well as more stringent environmental regulations by governments.
In Canada's waste management industry, market share concentration remains relatively low. Waste Connections Inc., Waste Management Inc. and Secure Energy Services Inc. have been identified as the largest three waste management operators in the Canadian market.
U.S. Market Size & Structure
The U.S. waste management market size was valued at USD 342.7 million in 2023 and is expected to reach a compound annual growth rate (CAGR) of 5.2% from 2024 to 2030. The growth of the US waste management market is driven by several factors. The expanding population and increased globalisation have led to an increase in waste generation volume. This, is coupled with mounting environmental concerns and the adoption of sustainable waste management practices across industries. The proliferation of illegal dumping and increased pollution have also contributed to the strong growth of the market.
WM maintains a virtual duopoly over the garbage industry in the U.S. along with Republic Services. The company leads with a market share of 53%. Collectively, the two companies collect more than half of all garbage in the U.S.
Competitor Analysis
North American Waste Management Companies
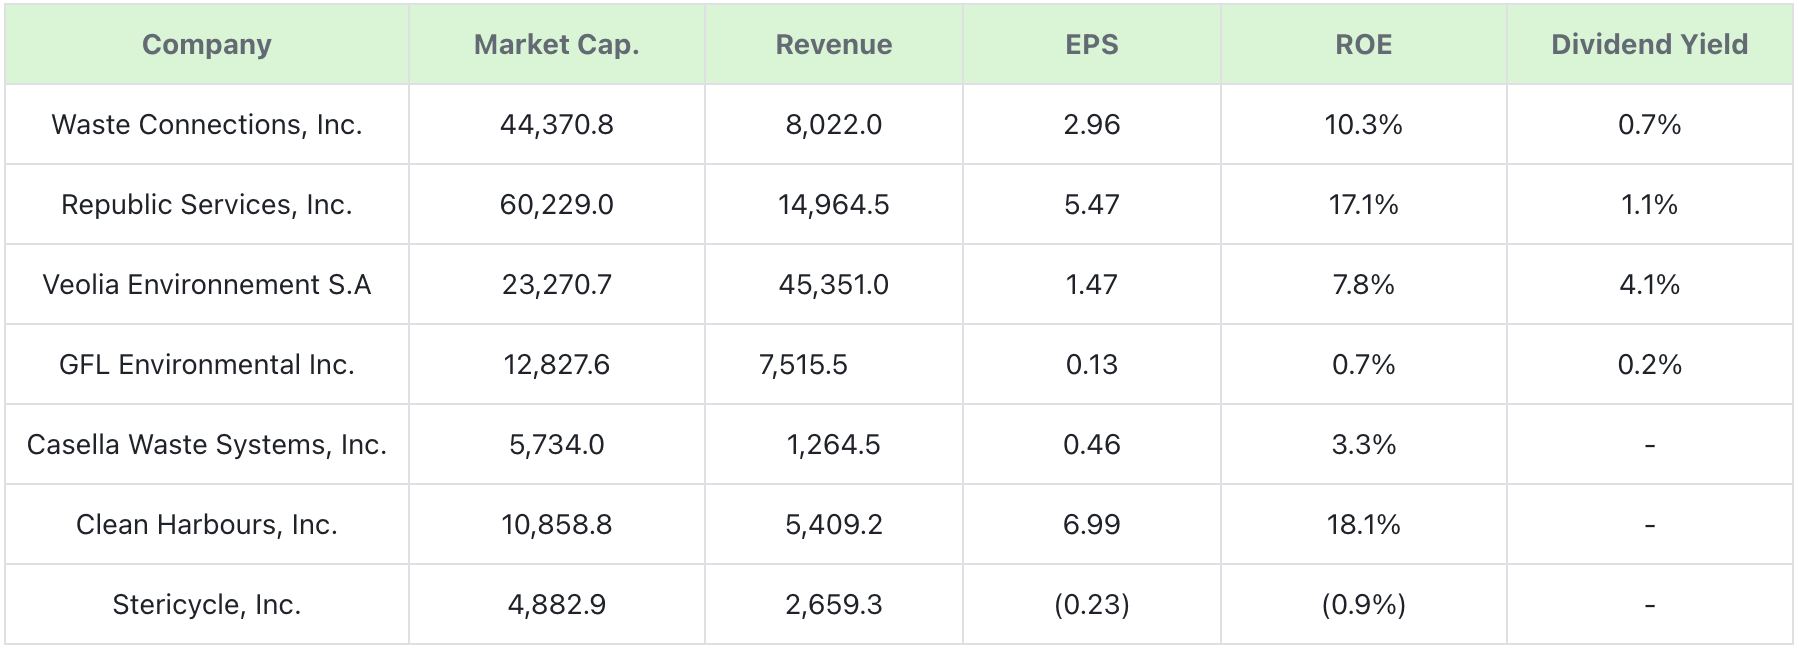
Waste Connections, Inc. - Headquartered in Woodbridge, Canada, Waste Connections provides non-hazardous waste collection, transfer, disposal, and recycling services in the United States and Canada.
Republic Services, Inc. - Based in Phoenix, Arizona, Republic Services, Inc. offers environmental services in the United States and Canada.
Veolia Environnement S.A - Headquartered in Paris, France, Veolia Environnement SA designs and provides water, waste, and energy management solutions worldwide, focusing on resource management and environmental services.
GFL Environmental Inc. - Headquartered in Vaughan, Canada, GFL Environmental Inc. Offers solid waste management and environmental services in Canada and the United States, including collection, transportation, recycling, and disposal.
Casella Waste Systems, Inc. - Headquartered in Rutland, Vermont, Casella Waste Systems, Inc. Operates as a vertically integrated solid waste services company in the United States, providing collection, transfer, recycling, and disposal services.
Clean Harbours, Inc. - Based in Norwell, Massachusetts, Clean Harbors, Inc. Provides environmental and industrial services, including hazardous waste disposal, industrial maintenance, and specialty services in the United States and internationally.
Stericycle, Inc. - Based in Bannockburn, Illinois, Stericycle, Inc. specialises in regulated waste and compliance services, including medical waste disposal, secure information destruction, and compliance solutions in the United States, Europe, and internationally.
Porter's Five Forces
Competition Within The Industry - High
With numerous large players and low switching costs, the competitive rivalry in the waste management/garbage industry is high.
Bargaining Power Of Buyers - Moderate
While individual customers may have limited bargaining power, larger commercial and municipal customers can negotiate contracts and prices based on volume. However, switching costs for customers can be high due to the specialised nature of waste management services. Thus, the bargaining power of buyers is moderate.
Bargaining Power Of Suppliers - Moderate
Suppliers providing necessary equipment and supplies to waste management companies establish substantial bargaining power due to their direct impact on the company’s operations. However, due to the dominant market position and wide geographical coverage by WM, suppliers’ bargaining power is moderate as the company does not procure from a single supplier and could negotiate favourable terms.
Threat Of New Entrants - low
The waste management industry needs a significant capital investment in equipment, and facilities (e.g. landfill) while meeting stringent environmental regulatory requirements. As such, the threat of new entrants who could not achieve economies of scale would be low.
Threat Of Substitutes - Low
Waste management services are essential for maintaining public health and environmental sustainability. There are few viable substitutes for waste collection, recycling, and disposal services. Thus, the threat of substitutes remains low.
Economic Moat
WM adopts a resilient business model and benefits from a wide economic moat established through intangible assets and cost advantage.
Cost Advantage
WM benefits from economies of scale and operational efficiency derived from its wide customer base and extensive network of infrastructures. As one of the largest waste service providers in the U.S., WM is able to spread fixed costs over a larger volume of the waste handle and lower its average cost per unit of service, making it difficult for smaller competitors to compete based on price. Additionally, economies of scale enable WM to invest in advanced technology, innovation, and sustainable practices, further enhancing its competitive advantage.
Intangible Asset
The waste management industry is heavily regulated, requiring companies to comply with environmental, health, and safety regulations at local, municipal, state, and federal levels. WM has been consistently compliant with these regulations for its landfill operations and its expertise in navigating complex regulatory environments creates a significant barrier to entry for new competitors. These stringent regulatory requirements may also pose challenges for existing competitors (and impact their operations), further solidifying WM's market position.
Financial Performance
WM has consistently delivered strong financials, including high ROE and low volatility, making it a solid long-term investment.
Profitability Analysis

In the last five years, WM has shown a positive trend in revenue growth, rising by 32.16% from $15,455.0 million in 2019 to $20,693.0 million in the trailing twelve months ending in March 2024. In comparison to its industry peers, WM has also performed well both in terms of absolute and relative revenue performance.
Return on Assets

WM's strong profitability is underscored by its superior return on assets (ROA) compared to its industrial peers. Despite a decline from 6.90% in 2019 to 5.40% in 2020 due to the pandemic, WM's ROA has steadily climbed to 7.40% by 2023.
Return on Equity

WM's profitability is further evidenced by its return on equity (ROE) figures. Similar to its ROA, WM's ROE dropped from 25.00% in 2019 to 20.60% in 2020 due to the pandemic, but has since steadily risen to 33.10% in 2023. This demonstrates WM's improvement in efficiently utilising its equity financing to generate profits.
Return on Capital

WM's profitability is also evident in its return on capital (ROC), which evaluates its effectiveness in deploying capital. Over the past five years, WM has consistently outperformed its competitors while enhancing its ROC.
Margin Analysis

WM has maintained relatively stable gross margin, EBITDA, EBIT and net income margins. These stable margins reflect the financial health and stability of WM's business. A consistent EBIT margin also indicates that the company is generating stable and sustainable profits to meet debt obligations and operations. Moreover, maintaining stable margins also signals WM's competitive strength within the waste management industry, indicating that the company has pricing power, cost control measures, and a solid market position relative to its competitors.
Dividends


WM is committed to growing shareholder returns and maintains a strong track of dividend growth. The company has been increasing the dividend rate for more than 15 years with a compound annual growth rate of approximately 6% over the last 5 years.
Investment Theses
Market Leader With Diversified & Stable Revenue Streams
WM stands as a market leader in the waste management industry, leveraging its extensive customer network and diversified revenue streams to drive sustainable growth and long-term value. As the largest waste management company in North America, WM has built a reputation for reliability and excellence, providing a wide range of services across the entire waste management spectrum. These services include collection, recycling, disposal, and renewable energy solutions, ensuring that WM can meet the diverse needs of its residential, commercial, and industrial customers.
WM’s comprehensive and integrated service offerings are key to its market leadership and financial robustness. By catering to various sectors with different needs, WM has created a diversified revenue base that reduces reliance on any single source of income. This revenue diversification ensures more stable and consistent revenue streams as WM captures and maintains a significant share of the market, fostering long-term customer relationships and loyalty.
The company’s diversified revenue streams translate into consistent and stable revenue growth, which in turn generates strong cash flow. This financial strength allows WM to capture growth opportunities, such as renewable energy projects, that align with sustainability trends. Additionally, the robust top-line performance also enables WM to return value to shareholders through regular dividends and share buybacks. WM’s robust cash flow also supports a strong balance sheet, enabling the company to manage debt effectively and maintain healthy financial leverage, which is crucial for navigating economic cycles and unexpected market challenges.
WM’s market leadership, paired with its diversified & stable revenue streams create a compelling investment proposition. The company’s ability to generate strong, recurring cash flow positions it well to meet future industry challenges and regulatory demands, driving long-term value for investors.
Strategic Focus On Sustainability Well Positioned To Capture ESG Opportunities
WM’s strategic focus on sustainability is well positioned for it to capture ESG growth opportunities through expanding its recycling capabilities, emission reduction initiatives and investing in innovative waste-to-energy technologies. WM can capitalise on the growing demand for sustainable waste management for its top-line performance due to increasing environmental concerns and regulations.
As countries shift towards a circular economy, waste is increasingly recognized as a valuable resource that can be reused, recycled, and processed. As the largest recycler of post-consumer materials, WM is able to recover more post-consumer materials than any other provider in North America. The company’s Material Recovery Facilities (MRFs) provide manufacturers with a reliable source of recyclables, serving as essential material inputs. WM’s proactive approach to incorporating new materials into its recycling programs, such as polypropylene (PP) and post-consumer resin (PCR), further strengthens its market position. Initiatives like the Association of Plastics Recyclers (APR) Demand Champion Program and partnerships with organisations like Cascade Cart Solutions demonstrate WM’s commitment to promoting the use of recycled materials. The company also invests in advanced recycling technologies and automation that improve material capture rates and operational efficiency. Through its recycling business, WM can unlock value from downstream materials and enhance its top-line performance.
With cleaner and renewable energy solutions gaining momentum, WM’s strategic focus in growing its renewable energy segment also presents growth opportunities. The company operates or hosts over 130 landfill gas-to-energy facilities, with 17 producing renewable natural gas. By capturing and converting landfill gas into energy, WM creates an additional revenue stream while contributing to greenhouse gas reduction. Plans to invest over $1 billion in new renewable natural gas facilities by 2026 further underscore WM’s commitment to expanding its renewable energy segment.
In conclusion, WM is well-positioned to benefit from the increasing demand for sustainable waste management solutions. With its strategic focus on sustainability, WM is poised to drive top-line performance and deliver long-term value to investors in the evolving landscape of waste management.
Wide Economic Moat and Cost Optimisation Efforts On Track To Improve Margin Gains
With the largest network of waste management facilities in North America, WM’s extensive infrastructure is a key cost advantage. The company operates over 300 landfills, more than 140 recycling facilities, and numerous transfer stations. This wide economic moat enables WM to achieve operational efficiencies, lower costs, and provide reliable services across a broad geographic area.
Additionally, WM’s investment in automation and technology enhances the efficiency and effectiveness of its operations, improving margin gains. By implementing routing optimization tools and automating residential routes, WM has been able to streamline its operations and reduce operating costs. These efforts have led to reductions in labour costs and repair expenses, particularly in its collection lines. By embracing technology and automation, WM has been able to improve the efficiency of its waste management processes, lowering costs while maintaining high service standards. The result of WM's cost optimization efforts is demonstrated by its revenue growth of 5.5% in Q1 2024, which was driven by improved operational efficiency and cost savings achieved through technology-driven initiatives.
Thus, WM's economic moat and commitment to cost optimization through technology and automation is a key driver of its margin gains. By focusing on operational efficiencies and reducing costs, WM can improve its profitability and deliver value to its shareholders.
Valuation
Discounted Cash Flow Model
This report employs the DCF model as its primary valuation methodology. Based on the DCF model, the 3-year and 5-year target prices of WM are USD $238.33 and $269.84 respectively. The inputs used in the DCF model are described below:
Beta: A beta of 0.71 was used for WM in the DCF model. This beta is calculated by dividing the product of the covariance of the security's returns and the market's returns by the variance of the market's returns over 5 years. The market selected is the NYSE Composite Index (^NYA). WM’s historical stock price data and NYSE Composite Index price data were retrieved from Capital IQ.
Cost of Equity: The cost of equity of 6.4% was derived based on the Capital Asset Pricing Model. The risk-free rate of 4.52% was computed using the USA 10-year treasury yield. The equity risk premium is 2.66%.
Cost of Debt: A corporate yield curve rate of 5.21% is used. An after-tax Cost of Debt of 4.0% was derived after accounting for a tax shield from a tax rate of 22.43%.
Weighted Average Cost of Capital: A WACC of 6.04% was computed using the WACC formula - WACC=(E/V×R(e))+(D/V ×R(d)×(1−T(c))).
Projected Revenue Growth: The revenue growth was projected under 3 scenarios - (a) Bull, (b) Base and (c) Bear. The bull, base and bear scenarios project revenue at 7.00%, 5.00% and 3.00% respectively till 2026. The revenue growth rates are then projected at 4.00%, 3.00% and 2.00% respectively from 2026 to 2028.
Terminal Growth Rate: A terminal/perpetuity growth rate of 3% is assumed.
Sensitivity Analysis: A sensitivity analysis on the WACC and terminal growth rate was conducted to stress-test the valuations.

Scenario Analysis: Three scenarios - (a) Bull, (b) Base and (c) Bear - were created to stress test the DCF model. Based on the analysis, the 3-year target price of WM is $228.30 to $248.56 while the 5-year target price ranges from $253.39 to $286.96.
Relative Valuation Method
A company-comparable analysis is also performed when evaluating WM. This encompasses the Total Enterprise Value Multiples and Pricing Multiples. The Total Enterprise Value multiples computed are TEV/Revenue, TEV/EBITDA, and TEV/EBIT, while Pricing Multiples consist of the P/E ratio. The results of the analysis are shown below:

Football Field Analysis
The Football Field Analysis shows the 3-year target prices for WM using different valuation methods.

Investment Risks & Mitigation
Regulatory Changes and Compliance Cost: The waste industry is subjected to extensive regulations and oversight. WM and its competitors are subjected to several federal, state, provincial, and local regulations in the U.S. and Canada. These regulations impact almost every aspect of the companies' operations, including environmental regulations, health and safety rules, transportation laws, and zoning and land-use matters.
Shifts in (environmental and workplace safety) regulatory policies may significantly impact the company's operational and financial performance. For instance, regulatory changes may mandate new practices or technologies, leading to increased capital expenditures and operational complexities. Such regulatory development introduces an element of uncertainty and underscores the importance of closely monitoring regulatory developments that could directly affect WM's operations.
Mitigation: WM invests in advanced technology and infrastructure to stay ahead of regulatory requirements. For instance, WM’s connected Landfill™ technology is automated with telematics that offers their technicians and operations managers real-time data in a dashboard format that can be viewed remotely. By proactively monitoring emerging regulatory trends and developments, WM can also anticipate changes and adapt its operations accordingly. For instance, WM is seeking ways to capture and recycle more material to meet consumer demand for recycled content in the years to come as states are passing laws requiring companies to use recycled content in new products and packaging.
Labour Unions: North American companies, such as WM, are often subjected to collective bargaining agreements by employees through labour unions. For instance, 450 employees of WM, who are members of the International Brotherhood of Teamsters union, negotiated for a five-year agreement that contains “numerous improvements to benefits, contract language and working conditions.” Employees' demands for higher wages and employment benefits, or resistance to the introduction of new technology and other initiatives could result in increased operating expenses and lower net income. Failure to negotiate acceptable collective bargaining agreements also increases operating expenses through work stoppages, including strikes. Additionally, WM is highly susceptible to such risks as a large portion of its workforce are hourly personnel, and many of these individuals, particularly in its recycling business, are paid at rates related to federal and state minimum wages.
Mitigating Factor: WM is able to bring in workers from other plants for their operations in the event of a strike. Such arrangements could ameliorate some pain for WM should there be a significant disruption to any area.
ESG Ratings Across Rating Agencies
This report reviews the ESG scores given by multiple rating agencies to provide a comprehensive view of WM’s ESG performance. Overall, WM is performing well in terms of ESG relative to its industrial peers.
Sustainalytics Risk Rating
Sustainalytics’ ESG risk ratings assess the degree to which a company’s enterprise value is at risk driven by environmental, social and governance issues. WM is given a low total ESG risk score of 16.7, which places the company at the 16th percentile.

S&P Global ESG Score
The S&P Global ESG Score assesses a company's performance on and management of material ESG risks, opportunities, and impacts through various sources, including company disclosures, media and stakeholder analysis, modelling approaches, and in-depth company engagement via the S&P Global Corporate Sustainability Assessment (CSA). The rating agency gave WM a score of 62/100 in October 2023, well above the industry average score.

Refinitiv
ESG scores from Refinitiv measure a company's relative ESG performance, commitment and effectiveness across 10 main themes (emissions, resource use, innovation, human rights, product liability, workforce, community, management, shareholders and CSR strategy) based on publicly disclosed data. WM is rated an ESG score of 85/100 from Refinitiv. A detailed breakdown of the specific ESG category scores is shown below:

MSCI ESG Rating
MSCI ESG Ratings are industry-relative assessments and are determined at the company level. Ratings are on a global seven-band scale from AAA (the highest ESG Rating) to CCC (the lowest ESG Rating). WM is rated a score of “A”, placing the company in the average range. On the climate scale, WM is also well aligned with the Paris Agreement goal of limiting temperature rising to below 2.0 Degrees Celsius.

Conclusion
Overall, this report recommends a “Buy” on Waste Management Inc. (NYSE:WM). The 3Y and 5Y target prices based on a DCF analysis are $238.33 and 269.84. In terms of ESG, WM is also performing better than its peers, as shown by its better ESG ratings from various rating agencies.
Appendix
Financial Ratios

*Do note that all of this is for information only and should not be taken as investment advice. If you should choose to invest in any of the stocks, you do so at your own risk.