


Initial Report: American Express (NYSE: AXP), 71.3% 5-yr Potential Upside (Claire CONTRI, SC VIP)
Claire CONTRI presents a "BUY" recommendation for American Express based on its unique business model, brand strength, and focus on affluent clientele position.


1. Executive Summary
American Express (AXP) presents a compelling investment opportunity within the global payments industry. While the industry faces evolving competitive dynamics, AXP's unique business model, brand strength, and focus on affluent clientele position it for continued growth and profitability.
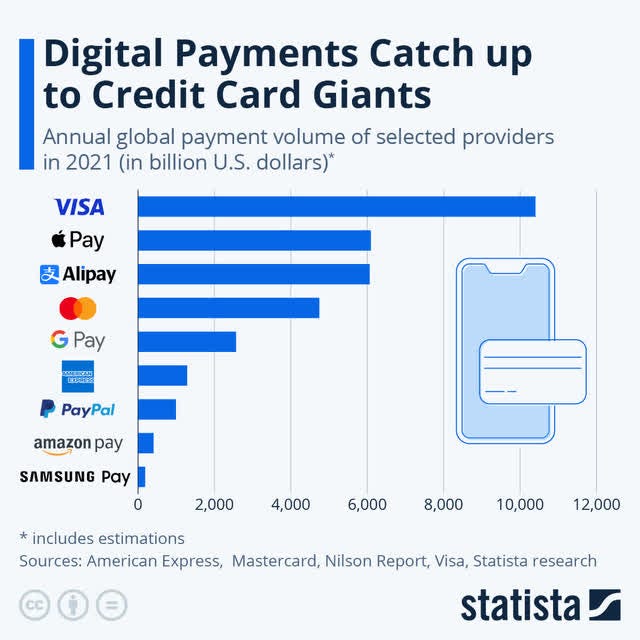
The global payments market is experiencing robust growth, driven by increasing digitalization, e-commerce expansion, and rising consumer spending. According to Statista, the global digital payments market was projected to reach $8.49 trillion in 2024, with a further expected annual growth rate (CAGR 2024-2028) of 10.74%, resulting in a projected market volume of $12.82 trillion by 2028. However, the market is also becoming increasingly competitive, with the emergence of fintech companies and alternative payment methods like Buy Now Pay Later (BNPL) and mobile wallets. This increased competition pressures traditional payment processors to innovate and differentiate their offerings.
Moreover, American Express's unique "closed-loop" payments network, which acts as a card issuer and merchant acquirer, distinguishes it from open-loop networks like Visa and Mastercard. This structure enables AXP to cultivate strong customer relationships by focusing on a premium segment and offering valuable benefits like Membership Rewards and airport lounge access, driving loyalty and higher average revenue per user. Furthermore, it allows AXP to control transaction economics by capturing merchant discounts and card member fees, creating a diversified and more resilient revenue stream. Finally, the closed-loop system reinforces AXP's brand prestige, synonymous with premium service and exclusivity, enabling the company to command higher fees and attract affluent customers while maintaining a premium pricing strategy.
In addition, American Express has demonstrated strong financial performance. In 2024, they reported total revenues of $65.9 billion, representing a 9% increase year-over-year (or 10% on an FX-adjusted basis). Net income was $10.1 billion, up 21% year-over-year. Earnings Per Share (EPS) reached $14.01, a 25% increase year-over-year. The company’s focus on cost optimization and strategic investments in technology, such as enhancements to its mobile app and digital customer experience, advancements in data analytics for personalized offers and risk management, and investments in fraud prevention and security technologies, contribute to its profitability.
Hence, American Express presents a compelling investment opportunity in the dynamic luxury market. The company's unique value proposition lies in its ability to have:
Premium Brand and Customer Base: AXP's strong brand and focus on affluent customers provide a competitive advantage, leading to higher spending and loyalty.
Diversified Revenue Streams: The closed-loop network generates revenue from merchant and cardmember fees, offering a more balanced revenue model.
Strong Financial Performance: AXP has a consistent financial performance and profitability history, demonstrating its resilience and ability to generate shareholder value.
Strategic Investments: AXP invests in technology and innovation to enhance its offerings and expand its reach, ensuring it remains competitive in the evolving payments landscape.
In a nutshell, while all investments carry some level of risk, American Express offers a strong risk-reward profile. The company’s diversified revenue streams, consistent financial performance, and focus on premium consumer segments help mitigate economic downturn risks. Additionally, its strategic expansion into digital payment solutions positions it well for long-term growth in the evolving financial landscape.
In conclusion, American Express represents a well-positioned investment in a high-growth industry, offering the potential for significant long-term returns.
2. Company Overview & History
The American Express Company, or Amex, is an American bank holding company and multinational financial services corporation specializing in payment cards. Headquartered at 200 Vesey Street in Battery Park City, Lower Manhattan, Amex is the fourth-largest card network globally by purchase volume, following China UnionPay, Visa, and Mastercard. As of December 31, 2023, there were 141.2 million Amex cards in force worldwide, with an average annual spend per card member of US $24,059 and a total purchase volume of over $1.7 trillion. Amex is the 16th largest US bank, with US $270 billion in assets, representing 1.1% of all FDIC-insured assets. It is ranked 77th on the Fortune 500, 28th on Forbes' list of most valuable brands, and 63rd in the 2023 Forbes Global 2000. Amex also owns a direct bank.
The Express Delivery Era (1850-1890s)
American Express began as a freight-forwarding company in Buffalo, New York, handling the secure transport of valuable goods, mail, and currency. Founded by Henry Wells, William G. Fargo, and John Butterfield, the company quickly earned a reputation for reliability and speed, becoming a trusted partner for businesses and individuals needing to move valuable items. This foundation in secure transportation laid the groundwork for its future ventures.
The Birth of Traveler's Cheques (1891)
Recognizing the growing need for a secure way for travelers to carry money, American Express introduced the traveler's cheque in 1891. This revolutionary product offered a safer alternative to carrying cash, protecting travelers against loss or theft. The traveler's cheque became synonymous with secure travel, marking a pivotal moment in Amex's transition from a transportation company to a financial services provider. It established the company's reputation for innovation and customer service.
Expansion and Diversification (Early 1900s - Mid-1900s)
The early 20th century saw American Express expand its services and brand. It began offering travel services, including booking transportation and accommodations, further solidifying its connection to the travel industry. This period also saw the company start to issue charge cards, a precursor to modern credit cards, which allowed cardholders to make purchases on credit and pay the balance in full at the end of the month. This innovation marked the company's entry into the consumer finance market.
The Rise of the Credit Card (Mid-1900s - Late 1900s)
The latter half of the 20th century was a period of significant growth and transformation for American Express. The company continued to refine its charge card offering and eventually introduced revolving credit cards, which allowed cardholders to carry a balance. The iconic Centurion Card (later known as the Amex Black Card) was launched in 1958, catering to the ultra-affluent and further cementing Amex's image as a premium brand. During this time, American Express diversified its business, venturing into areas like insurance and investment products.
Adapting to a Changing Landscape (Late 1900s - Present)
As the financial landscape evolved, American Express faced increasing competition from other payment processors and the rise of digital payment technologies. The company strategically focused on its core competencies: charge and credit cards, travel, and merchant services. Amex invested heavily in technology to enhance its digital platforms, mobile app, and online customer experience. It also continued to focus on its premium customer base, offering a range of exclusive benefits and rewards programs. In recent years, American Express has emphasized its commitment to environmental, social, and governance (ESG) initiatives, reflecting the growing importance of sustainability and social responsibility in business.
Hence, American Express's history is one of continuous adaptation and innovation. From its origins as an express delivery company to its current status as a global payments leader, American Express has consistently evolved to meet the changing needs of its customers and the marketplace. Its focus on brand prestige, customer loyalty, and technological innovation has enabled it to remain a prominent player in the financial services industry for over 170 years.
3. Business Segments
American Express operates through four primary business segments, each focusing on different customer groups and financial services. These segments—U.S. Consumer Services (USCS), Commercial Services (CS), International Card Services (ICS), and Global Merchant & Network Services (GMNS)—drive revenue through card issuance, lending, merchant partnerships, and payment processing. The company's closed-loop model, which allows it to act as both a card issuer and payment network, gives it a distinct advantage over competitors like Visa and Mastercard.

U.S. Consumer Services (USCS)
The U.S. Consumer Services segment focuses on American Express’s individual customers within the United States, providing a broad range of proprietary consumer credit and charge cards, as well as travel, lifestyle, and banking services.
Key offerings within this segment include:
Personal Credit and Charge Cards: American Express issues a variety of premium and rewards-based cards, including the Platinum Card®, Gold Card®, and Blue Cash®, tailored to different consumer spending habits.
Membership Rewards Program: This highly regarded loyalty program allows customers to earn and redeem points for travel, statement credits, and exclusive experiences.
Consumer Banking & Lending Products: The company provides high-yield savings accounts, personal loans, and non-card financing options, including its Buy Now, Pay Later (BNPL) services like Plan It® and Pay Over Time.
Travel & Lifestyle Benefits: Customers receive premium perks, such as airport lounge access (Centurion Lounge Network), concierge services, exclusive hotel partnerships, and airline discounts.
Revenue Model: USCS generates revenue primarily from cardholder spending (merchant discount fees), annual membership fees, and interest income from credit card balances. This segment accounts for a significant portion of American Express's total revenue.
Commercial Services (CS)
The Commercial Services segment serves businesses in the United States, offering corporate and small business cards and financial management solutions. It also serves select global corporate clients.
Key offerings include:
Corporate & Small Business Credit Cards: Products such as the Business Platinum Card®, Corporate Green Card®, and Delta SkyMiles Business Card® help businesses manage expenses and earn rewards.
Expense & Payment Management Solutions: American Express provides tools that integrate with platforms like SAP Concur and QuickBooks, helping businesses track and control their spending.
Business Financing & Lending: Companies can access short-term loans, business lines of credit, and working capital solutions to optimize cash flow.
B2B Payments & Vendor Management: This segment facilitates secure business transactions and supplier payments through specialized merchant relationships and corporate card solutions.
Revenue Model: CS generates revenue from merchant fees, lending interest, annual card fees, and business financial services.
International Card Services (ICS)
The International Card Services segment focuses on card issuance and financial services outside the United States, offering products to consumers, small businesses, and corporations worldwide.
Key offerings include:
Proprietary Consumer & Business Cards: American Express issues personal, small business, and corporate cards internationally, often through local partnerships and joint ventures.
Travel & Lifestyle Services: Similar to its U.S. counterpart, ICS offers concierge services, premium travel benefits, and international banking solutions.
Loyalty Coalition & Rewards Programs: American Express partners with local businesses in specific markets to provide exclusive cardholder benefits.
Joint Ventures & Strategic Partnerships: ICS manages international partnerships, including co-branded card programs and financial collaborations with foreign banks.
Revenue Model: ICS earns revenue from merchant discount fees, annual card fees, and co-branded partnerships.
Global Merchant & Network Services (GMNS)
The Global Merchant & Network Services segment focuses on the company’s payment network operations, processing transactions, acquiring merchants, and managing third-party partnerships.
Key responsibilities within this segment include:
Merchant Acquisition & Partnerships: American Express expands merchant acceptance worldwide, negotiating discount rates and providing tailored payment solutions.
Payment Processing & Settlement: This segment facilitates and settles transactions for cardholders and merchants, ensuring seamless payments through its closed-loop system.
Network Partnerships & Licensing: GMNS oversees third-party card issuers, including network agreements in China, and licenses the American Express brand to expand its global reach.
Data Analytics & Marketing Services: American Express provides merchants with customer insights and marketing tools, helping businesses optimize their engagement strategies.
Revenue Model: GMNS generates revenue from merchant discount fees, licensing agreements, and payment processing services.
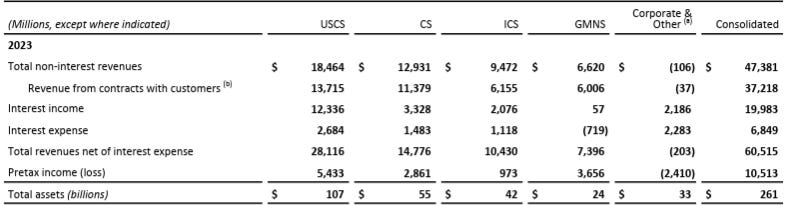
In 2023, American Express (AXP) generated $60.52 billion in net revenues after interest expenses, with U.S. Consumer Services (USCS) leading at $28.12 billion, followed by Commercial Services (CS) at $14.78 billion, and International Card Services (ICS) at $10.43 billion. The Global Merchant & Network Services (GMNS) segment contributed $7.40 billion, playing a key role in payment processing and merchant services. Despite strong overall profitability, Corporate & Other reported a $2.41 billion loss, likely due to corporate expenses. The company held $261 billion in total assets, with USCS as the dominant segment. American Express continues to be heavily driven by consumer credit and spending, with substantial contributions from business services and merchant operations.

Moreover, from 2021 to 2023, American Express consolidated revenues, rising from $42,380 million in 2021 to $60,515 million in 2023, driven primarily by strong United States growth, which accounted for about 78% of total revenues in 2023. The EMEA and APAC regions also showed steady revenue and income growth, suggesting effective regional strategies. However, the "Other Unallocated" category reported notable losses, highlighting potential areas for cost optimization. Despite a slight dip in 2022, consolidated pretax income remained robust at $10,513 million in 2023, with all regions contributing positively except for the unallocated segment. Overall, American Express's financial results reflect a strong performance in its core markets, balanced by challenges in managing unallocated costs.
Therefore, American Express’s four business segments work together to create a comprehensive financial ecosystem, balancing consumer banking, business financing, international expansion, and merchant services. By leveraging its integrated network and strong customer relationships, the company continues to grow its market presence and maintain a competitive advantage in the financial services industry.
4. Industry Overview
4.1 Market Size
The global payments market is experiencing substantial growth, driven by increasing digitalization, e-commerce expansion, and evolving consumer behavior. While precise figures vary depending on the source and definition of the market, estimates suggest a multi-trillion dollar market size. For example, Statista projected the global digital payments market to reach $8.49 trillion in 2024, with a further expected annual growth rate (CAGR 2024-2028) of 10.74%, resulting in a projected market volume of $12.82 trillion by 2028. This robust growth is fueled by several key trends, including the increasing adoption of mobile wallets and contactless payments, the continued expansion of e-commerce, the rise of real-time payments, and growing financial inclusion in emerging markets. Competition within the payments landscape is also intensifying, with traditional players like American Express facing challenges from innovative fintech companies and alternative payment solutions.
4.2 Growth Drivers
4.2.1 Digital Transformation
Digital transformation is not merely a surface-level shift but a profound restructuring of global financial interactions. The ubiquity of smartphones and the rapid expansion of high-speed internet access have fundamentally altered consumer behavior, creating a demand for seamless, instant, and secure digital payment solutions. Mobile wallets like Apple Pay and Google Pay have become commonplace, offering a frictionless payment experience at point-of-sale and within e-commerce environments. Contactless payments, driven by near-field communication (NFC) technology, have accelerated transaction speeds and reduced physical contact, a trend amplified by health and safety concerns. Beyond these consumer-facing technologies, the digital transformation extends to the back-end payment processing infrastructure. Cloud-based payment platforms, Application Programming Interfaces (APIs), and data analytics enable greater efficiency, scalability, and personalization. Furthermore, the rise of embedded finance, where payment functionalities are integrated directly into non-financial applications, blurs the lines between traditional financial services and other sectors, creating new avenues for payment innovation. This digital revolution is not just about adopting new technologies; it’s about creating an interconnected financial ecosystem that prioritizes user experience, security, and accessibility.

4.2.2 E-Commerce Growth
Secondly, the explosive growth of e-commerce has become a primary driver of the global payments market, reshaping retail and service industries worldwide. Online marketplaces, direct-to-consumer brands, and subscription-based services have proliferated, creating a vast network of digital transactions. The demand for secure and efficient online payment gateways has surged, leading to the development of advanced payment processing solutions that can handle high transaction volumes and complex payment flows. Cross-border e-commerce has further complicated the landscape, requiring payment providers to navigate diverse regulatory environments, manage currency conversions, and mitigate fraud risks associated with international transactions. Moreover, the emergence of social commerce, where purchases are made directly through social media platforms, adds another layer of complexity to the payment ecosystem. To cater to the evolving needs of e-commerce businesses, payment providers offer a suite of value-added services, including fraud detection, data analytics, and customer loyalty programs, to enhance the overall online shopping experience. This expansion of e-commerce is not just about increasing transaction volumes; it's about creating a global marketplace where seamless and secure payment experiences are paramount.

4.2.3 Financial Inclusion and The Rapid Growth of Emerging Markets
Financial inclusion and the rapid growth of emerging markets are significantly expanding the reach and scope of the global payments market. Digital payment technologies democratize access to financial services, particularly in regions with limited traditional banking infrastructure. Mobile money platforms, like M-Pesa in Kenya, have revolutionized financial transactions in developing economies, enabling individuals to send and receive money, pay bills, and access credit through their mobile phones. This expansion of financial inclusion stimulates economic activity, empowers marginalized communities, and fosters social mobility. Real-time payment systems, such as India's Unified Payments Interface (UPI), further accelerate this trend, enabling instant fund transfers and reducing reliance on cash-based transactions. The adoption of digital payments in emerging markets is also driven by government initiatives to promote financial inclusion and digitize public services. This convergence of technological innovation, government support, and consumer adoption is creating a fertile ground for the growth of the payments market in emerging economies. For example, fast-growing Asian markets are driving new business models and innovation. Alipay and WeChat Pay have created a new paradigm around “super-apps” as payment platforms in China. PwC’s latest global survey of senior financial services executives showed that 78% of respondents said Asian institutions will move faster on globalisation and convergence than the rest of the world up to 2025, with those in Europe and the Americas struggling to keep up.

4.2.4 The Rise of The Fintech Sector & Digital Currencies
Finally, the dynamic interplay of innovation and competition, fueled by the agile fintech sector, fundamentally reshapes the global payments landscape. Fintech companies are disrupting traditional payment models by introducing innovative solutions that leverage cutting-edge technologies. Blockchain technology, for instance, is being used to develop decentralized payment networks that offer greater transparency and security. Similarly, CBDCs — digital tokens or electronic records representing the virtual form of a nation’s currency—and private-sector cryptocurrencies- are predicted to have the most disruptive impact over the next 20 years. Moreover, Artificial intelligence (AI) is deployed to enhance fraud detection, personalize payment experiences, and automate customer service. Biometric authentication methods, such as fingerprint and facial recognition, improve security and streamline user verification. This competitive environment forces established players to adapt and innovate, leading to the development of more efficient, secure, and user-friendly payment solutions. Furthermore, regulatory changes, particularly those concerning open banking, data privacy, and cybersecurity, influence innovation, ensuring that new technologies are developed responsibly and ethically. This collaborative and competitive dynamic is propelling the global payments market forward, creating a more inclusive, efficient, and secure financial ecosystem for consumers and businesses worldwide.

4.3 Competitor Analysis
The competitor analysis provides a deeper insight into American Express's competitive landscape and overall market positioning relative to other key payment industry players. The following section compares American Express with its main competitors, highlighting selected ratios and performance metrics to illustrate their relative strengths and weaknesses.

4.3.1 Market Capitalization
Market capitalization, or "market cap," represents the total value of a company's outstanding shares and is a key indicator of its size and overall market valuation. Among the financial services companies in the dataset, American Express leads with a fully diluted market capitalization of approximately $191.7 billion, highlighting its dominant position in the industry. Capital One Financial follows with $68.2 billion, while Discover Financial and Synchrony Financial have market caps of $41.7 billion and $21.3 billion, respectively. These figures suggest that traditional credit card issuers and consumer finance companies command significant investor confidence, as reflected in their large market capitalizations. In contrast, smaller financial firms such as Vanquis Banking Group and QuickFee have much lower valuations, at $195.3 million and $17.77 million, respectively, indicating their niche presence and more limited scale within the financial sector.
Several factors influence market capitalization, including revenue growth, profitability, risk exposure, and investor sentiment. Companies with strong brand recognition, diversified product offerings, and consistent financial performance tend to achieve higher market valuations. For instance, American Express benefits from its premium cardholder base, global merchant acceptance, and strong brand equity, contributing to its substantial market cap. On the other hand, smaller firms often experience higher volatility in their valuations, as they may be more susceptible to economic fluctuations, regulatory changes, or competition from larger players. For companies operating in emerging markets or specialized financial services, achieving a higher market cap often requires strategic expansion, innovation, and enhanced investor confidence in long-term profitability.
4.3.2 Revenues
Revenue is a crucial measure of a company’s financial strength, indicating the total income generated from its core business activities. In the dataset, American Express again emerges as the leader, reporting annual revenue of $74.19 billion, followed by Capital One Financial at $53.67 billion. These figures reflect these companies' substantial scale and consumer reach, as they derive income from credit card transactions, merchant fees, and financial services. While smaller in comparison, discover Financial and Synchrony Financial still generate significant revenues of $23.63 billion and $20.76 billion, respectively. These mid-sized financial institutions benefit from strong customer bases and diversified lending portfolios, which drive their revenue streams.
Smaller financial firms such as Vanquis Banking Group ($771.16 million) and QuickFee ($15.02 million) generate comparatively lower revenues, indicating their more specialized market focus. The variation in revenue across companies underscores differences in business models, geographic reach, and customer segmentation. Larger institutions with global operations and diverse financial products tend to report higher revenues, benefiting from economies of scale and extensive client networks. Meanwhile, niche players focusing on specific lending segments, digital financial services, or emerging markets may have smaller revenue bases. Still, they can achieve high growth rates through targeted expansion and technological innovation. Revenue trends also reflect macroeconomic conditions, as factors such as interest rate changes, consumer spending, and regulatory policies directly impact financial service providers’ earnings potential.
4.3.4 Enterprise Value (EV)
Enterprise value (EV) is a comprehensive measure of a company’s total valuation, incorporating market capitalization, debt, and cash holdings. Unlike market cap alone, which only accounts for equity value, EV provides a more holistic perspective on a firm's total worth, especially in industries where debt plays a significant role. In the dataset, American Express has the highest enterprise value at $202.2 billion, surpassing its market capitalization due to its debt obligations. Similarly, Synchrony Financial has an EV of $23.3 billion, slightly above its market cap of $21.3 billion, reflecting the leverage used in its financial operations.
Several companies, including Capital One Financial and Discover Financial, do not have reported EV figures, but those that do exhibit a range of valuation multiples. For instance, SBI Cards & Payment Services has an EV of $14.1 billion, significantly higher than its market cap of $9.4 billion, indicating a sizable debt component in its financial structure. EV is particularly useful when comparing companies with different capital structures, as it provides insight into how much a buyer would need to pay to acquire a company, including debt repayments. Firms with high EVs relative to their market caps typically operate in capital-intensive environments, requiring substantial borrowing to finance operations or expansion. Understanding EV in conjunction with other financial metrics allows investors to assess a company’s true valuation and its ability to generate returns despite its debt load.
4.3.4 P/E and EV/EBITDA Ratio
The price-to-earnings (P/E) ratio and the enterprise value-to-EBITDA (EV/EBITDA) ratio are essential valuation metrics that help investors assess a company’s relative worth. The P/E ratio measures how much investors are willing to pay for each dollar of earnings. In contrast, the EV/EBITDA ratio provides insight into a company's overall valuation in relation to its operating profits. QuickFee has the highest EV/EBITDA multiple in the dataset at 24.61x, followed closely by Credit Saison (24.22x) and Marui Group (19.58x). These high valuation multiples suggest that investors anticipate strong future earnings growth or that these firms operate in high-margin business segments.
On the other end of the spectrum, Synchrony Financial has the lowest EV/EBITDA ratio at 1.88x, indicating a relatively undervalued position compared to its earnings potential. A low EV/EBITDA multiple can be attributed to factors such as slower expected growth, higher risk exposure, or industry-specific challenges. With an EV/EBITDA of 9.23x, American Express sits within a moderate range, reflecting its strong financial standing and stable earnings power. The P/E ratio, though not explicitly listed in the dataset, generally aligns with the EV/EBITDA ratio in indicating investor sentiment and market expectations. A high P/E ratio suggests optimism about future earnings growth, while a low ratio may indicate concerns about profitability or economic conditions. Comparing these valuation metrics across companies helps investors gauge whether a stock is overvalued, fairly valued, or undervalued based on its earnings and growth potential.
5. Investment Thesis
American Express's (Amex) investment thesis revolves around its position as a leading global payments company with a premium customer base and a unique closed-loop business model that captures value at multiple points in the transaction process. Here are some key aspects of Amex's investment thesis:
5.1 Premium Brand and Loyal Customer Base
American Express has successfully established itself as a premium brand catering to affluent consumers and businesses. Its strategy emphasizes exclusivity, superior customer service, and a broad range of benefits that appeal to high-net-worth individuals. Unlike many of its competitors, Amex focuses heavily on providing personalized experiences, including access to exclusive events, premium travel benefits, and comprehensive rewards programs. This strategic focus has attracted a loyal customer base and enabled Amex to maintain high retention rates. According to a report by The Brand Hopper, Amex’s branding and marketing strategies are crucial in reinforcing its premium image, using targeted campaigns emphasizing trust and reliability. Moreover, the company’s ability to retain many long-term cardmembers speaks to the strength of its brand loyalty. This premium positioning allows Amex to command higher fees and generate more revenue per customer than other credit card companies, bolsters its profitability and competitive edge.

5.2 Unique Closed-Loop Business Model
Amex’s closed-loop business model is a significant differentiator from competitors like Visa and Mastercard, which primarily operate on open-loop networks. In the closed-loop system, Amex acts as both the card issuer and the payment processor, enabling it to control the entire transaction lifecycle. This model allows Amex to capture a larger share of transaction fees and gain comprehensive insights into customer spending behaviors, which it leverages to create customized offers and optimize its rewards programs. Furthermore, this structure enables Amex to directly manage relationships with cardmembers and merchants directly, facilitating more significant control over pricing, data security, and customer experience. According to FinShiksha, this vertical integration is a core strength of Amex’s business model, driving higher margins and operational efficiencies. Additionally, Amex's ability to integrate data from both sides of the transaction gives it a competitive advantage in managing risks and enhancing its marketing capabilities.

5.3 Expansion into Digital Payments and Technology Investments
Recognizing the rapid shift toward digital payments, Amex has invested heavily in technology to enhance its digital capabilities and improve customer experiences. The company’s focus on expanding its mobile and online payment solutions has been instrumental in attracting tech-savvy customers and retaining existing ones. Amex has also embraced AI and data analytics to offer personalized recommendations, fraud prevention, and efficient service delivery. According to the company's website, these investments have significantly enhanced Amex’s ability to provide seamless digital experiences, thereby increasing customer satisfaction and loyalty. Moreover, strategic partnerships with fintech firms and digital wallets have expanded Amex’s reach, allowing it to capture a larger share of the growing e-commerce market. Strategic partnerships with merchants further enhance this value proposition by offering unique discounts and benefits that competitors struggle to match. For example, Amex’s rewards programs are designed to be particularly appealing, enabling cardholders to redeem points for travel, merchandise, and exclusive experiences. This flexibility empowers customers to choose rewards that align with their preferences, enhancing the program’s appeal. These efforts underscore Amex’s commitment to staying ahead in the evolving payments landscape.

5.4 Geographic Expansion Opportunities
Amex’s extensive global presence, spanning over 100 countries and territories, positions it well to capitalize on growth opportunities in emerging markets. As disposable incomes and the adoption of digital payments continue to rise in regions such as Asia-Pacific and Latin America, Amex's premium brand and focus on affluent customers offer a significant advantage. The company has been actively expanding its merchant network and issuing partnerships in these markets to enhance acceptance and card member growth. Indeed, Amex’s strategy of focusing on premium markets aligns well with the increasing affluence in these regions, offering substantial long-term growth potential. Additionally, Amex’s ability to customize products to local market needs enhances its competitive positioning globally. For example, the graph below illustrates American Express's regional revenue growth from 2021 to 2023, showcasing substantial expansion in the United States market alongside steady increases in the EMEA (Europe, Middle East, Africa), APAC (Asia-Pacific), and LACC (Latin America, Canada, Caribbean) regions. The "Other Unallocated" category exhibits minor fluctuations, indicating effective management of costs that are not directly assigned to specific regions. This visualization underscores Amex's robust performance and strategic focus on international expansion while efficiently managing unallocated expenses.

In summary, American Express's investment thesis is built on its premium brand positioning, unique closed-loop business model, strong financial performance, and strategic emphasis on digital innovation. As the payments industry evolves with the growth of digital and mobile transactions, Amex's ability to leverage its brand strength, technology investments, and closed-loop model positions it well for sustained growth and profitability.
6. Valuation
6.1 Financial Summary
The Summary of Financial Performance table provides an in-depth look into the company’s financial evolution over the past three years, highlighting trends in revenue growth, expense management, and profitability.

Revenue Growth and Business Expansion
Total revenues net of interest expense increased by 14% in 2023, reaching $60,515M compared to $52,862M in 2022. While this marks a solid improvement, it represents a slowdown in growth compared to the 25% surge in revenue from 2021 to 2022. The revenue increase suggests the company is benefiting from higher transaction volumes, strong consumer and business spending, and potentially favorable pricing strategies. However, the deceleration in revenue growth raises questions about whether the company’s expansion is stabilizing after a period of rapid growth.
Rising Credit Risk and Provisions for Credit Losses
One of the most concerning trends in the table is the significant rise in provisions for credit losses, which more than doubled from $2,182M in 2022 to $4,923M in 2023. This represents a $2,741M increase, highlighting potential credit risks or economic challenges affecting the company’s loan portfolio. In contrast, in 2021, the company had negative provisions of -$1,419M, meaning it had released excess reserves rather than setting aside funds for potential loan defaults.
The sharp increase in provisions suggests the company is experiencing higher delinquency rates or expects a downturn in credit quality, possibly due to rising interest rates, economic uncertainties, or increased exposure to riskier borrowers. If credit losses continue to rise, this trend could put pressure on future profitability.
Expense Growth and Cost Management Challenges
The company’s total expenses have been rising consistently, growing by 10% in 2023 to $45,079M, compared to $41,095M in 2022. Over a two-year period, expenses have surged by 24%, representing an increase of $7,985M since 2021. The continued rise in expenses suggests higher operational costs, inflationary pressures, and potentially increased investments in technology, marketing, or expansion initiatives.
While controlled expense growth is expected in a growing company, the fact that expenses are outpacing revenue growth on a two-year basis could indicate potential margin compression. If expenses continue to rise at this pace, the company may need to focus on cost-cutting strategies, operational efficiencies, or price adjustments to sustain profitability.
Profitability and Earnings Trends
Despite increasing provisions and expenses, the company managed to grow its pre-tax income by 10% in 2023, reaching $10,513M compared to $9,585M in 2022. However, pre-tax income remains below the 2021 level of $10,689M, indicating that the company has not yet returned to peak profitability.
Similarly, net income increased by 11% from $7,514M in 2022 to $8,374M in 2023, but this represents only a modest improvement over the past three years. The fact that net income declined by 7% from $8,060M in 2021 to $7,514M in 2022 suggests that external economic factors, increased costs, and higher credit provisions impacted overall profitability.
Earnings Per Share (EPS) and Shareholder Value
One positive trend is the earnings per share (EPS) growth, which increased by 14% in 2023, from $9.85 in 2022 to $11.21. This EPS growth outpaced net income growth, suggesting that the company may have engaged in share repurchase programs, reducing the number of outstanding shares and boosting EPS performance. Share buybacks can be a strategic move to enhance shareholder value, but if executed excessively, they could limit the company’s ability to reinvest in growth initiatives.
Key Takeaways and Future Considerations
Overall, the company has demonstrated strong revenue growth and improved profitability, but rising credit risks and increasing expenses present potential challenges. The significant increase in provisions for credit losses suggests a higher-risk lending environment, while the continued rise in expenses could put pressure on margins. To maintain profitability and shareholder value, the company may need to focus on managing credit risks, optimizing cost structures, and ensuring sustainable revenue growth.
6.2 Stock Price Evolution
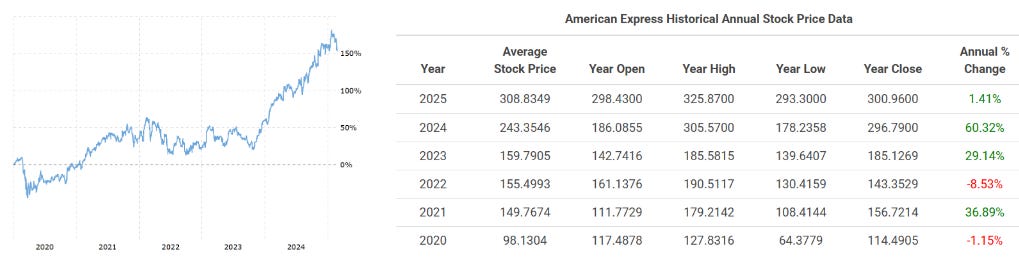
The graphs below show American Express's (Amex) stock performance from 2020 to 2025, indicating a strong upward trend overall.
Early 2020 Decline
At the beginning of 2020, Amex’s stock declined, closing the year with a slight drop of 1.15%. This downturn was likely a result of the COVID-19 pandemic's impact on travel, hospitality, and in-person transactions—key revenue streams for Amex. The restrictions and uncertainty during this period significantly affected consumer spending patterns.
Recovery and Growth (2021)
In 2021, the stock saw a remarkable rebound with an annual gain of 36.89%, driven by the easing of pandemic-related restrictions and a surge in consumer spending, particularly on e-commerce and digital payments. Amex's focus on expanding its digital capabilities and partnerships with fintech companies significantly affected this recovery. The company’s ability to leverage its closed-loop model to enhance customer insights and loyalty also contributed to this growth phase.
Challenges and Volatility (2022)
The year 2022 was marked by increased volatility, with the stock declining by 8.53%. This downturn can be attributed to macroeconomic factors such as rising inflation, interest rate hikes, and concerns about a potential recession. Despite these challenges, Amex’s strategic investments in technology and its focus on premium customers helped mitigate some of the adverse impacts.
Strong Uptrend (2023–2024)
Amex’s stock performance significantly improved in 2023 and 2024, with annual gains of 29.14% and 60.32%, respectively. Several factors likely fueled this robust uptrend:
Successful Digital Transformation: Investments in AI-driven services, mobile payments, and enhanced user experience boosted transaction volumes and customer retention.
Expansion into E-commerce: Strategic partnerships with fintech firms and an increased focus on e-commerce payments helped capture a larger share of online transactions.
Recovery in Travel Spending: The easing of travel restrictions led to a surge in spending on premium cards, which significantly benefited Amex’s revenue.
Stabilization and Minor Pullback (2025)
In 2025, Amex’s stock continued to grow, reaching an average price of approximately $308.83, with a modest annual gain of 1.41%. The slight pullback observed towards the end of the year appears to be a natural correction following the substantial gains of previous years. This stabilization phase may also reflect investor profit-taking and adjustments to evolving macroeconomic conditions.
Overall, American Express's stock performance reflects its strong brand positioning, successful execution of digital strategies, and effective adaptation to changing market conditions. The company’s focus on premium customers and strategic investments in technology and sustainability positions it well for long-term growth.
6.3 Financial Ratios

Valuation Analysis
The EV/Sales ratio, which measures enterprise value relative to revenue, declined from 3.00 in 2023 to 2.73 in 2024, indicating a slight decrease in the market’s valuation of the company’s revenue. However, it is projected to rise to 2.83 in 2025 before dropping to 2.61 in 2026, suggesting potential fluctuations in revenue growth expectations or enterprise value adjustments.
The EV/EBITDA ratio dropped from 10.51 in 2023 to 9.24 in 2024, indicating a lower valuation relative to earnings before interest, taxes, depreciation, and amortization (EBITDA). No projections are available for 2025 and 2026.
The EV/EBIT ratio followed a similar trend, declining from 11.50 in 2023 to 10.00 in 2024 and is expected to decline further to 10.27 in 2025 and 9.43 in 2026. This trend suggests that while EBIT may grow, the enterprise value is either stabilizing or not keeping pace with profitability improvements.
Interest Coverage & Leverage Analysis
The EBITDA/Interest Expense ratio, which measures a company's ability to cover interest payments with EBITDA, declined from 9.70 in 2023 to 8.57 in 2024, implying slightly reduced coverage due to higher interest expenses or lower EBITDA growth.
The EBIT/Interest Expense ratio decreased from 8.87 in 2023 to 7.91 in 2024, and estimates for 2025 and 2026 significantly dropped to 2.45 and 2.51, respectively. This sharp decline suggests that EBIT might not be growing as quickly as interest expenses, indicating increased financial risk.
The EBITDA - CapEx/Interest Expense ratio, a measure of how much free cash flow (excluding CapEx) is available to cover interest, dropped from 8.91 in 2023 to 7.82 in 2024, reinforcing concerns about decreasing financial flexibility.
The Total Debt/EBITDA ratio declined from 2.55 in 2023 to 2.33 in 2024, indicating a modest reduction in leverage. This suggests the company is either reducing debt or improving EBITDA, leading to lower relative leverage.
The Total Debt/EV ratio remains fairly stable, increasing slightly from 0.24 in 2023 to 0.25 in 2024, suggesting that debt remains a small component of enterprise value.
Market Sentiment & Valuation Trends
The Price-to-Earnings (P/E) ratio declined significantly from 24.14 in 2023 to 19.31 in 2024, with estimates projecting a further decline to 17.71 in 2025 and 15.44 in 2026. This drop suggests that the market expects either slower earnings growth or assigns a lower valuation multiple to the company, possibly due to concerns over profitability sustainability, interest expense burden, or overall market conditions.
Key Takeaways
Declining valuation multiples (EV/Sales, EV/EBITDA, EV/EBIT, P/E) suggest that the market is becoming more cautious about the company’s growth potential or profitability.
Interest coverage ratios are deteriorating (EBIT/Interest Expense, EBITDA/Interest Expense), indicating rising financial risk as interest costs increase.
Leverage (Total Debt/EBITDA) is improving slightly, but the company still faces potential financial strain.
Investors seem to be pricing in a lower growth trajectory, as reflected in the declining P/E ratio.
Overall, while the company remains profitable, increasing financial costs and a declining valuation multiple indicate a cautious outlook. Investors and management should closely monitor interest expenses and ensure earnings growth can sustain long-term economic stability.
6.4 Financial Forecasts
6.4.1 Income Statement
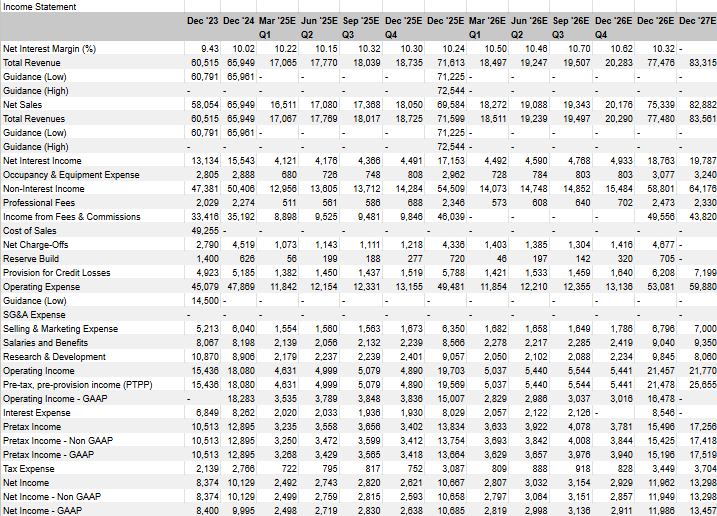
The Net Interest Margin (%) shows a general upward trend, starting at 9.43% in December 2023 and peaking at 10.32% in December 2027, indicating improved profitability from interest-earning assets. This aligns with the Total Revenue, which increased from $60,515 million in December 2023 to an estimated $83,315 million in December 2027, reflecting growth in the company's operations.
Net Sales also show a steady rise, beginning at $58,054 million in December 2023 and projected to reach $78,611 million in December 2027. This growth suggests strong demand and revenue generation, potentially supported by rising Net Interest Income, which increases from $60,791 million in December 2023 to $79,775 million in December 2027. Additionally, Income from Fees & Commissions steadily grows, reaching $8,323 million in December 2027, indicating a more diversified revenue base beyond interest income.
On the expense side, Operating Expenses increased from $45,079 million in December 2023 to an estimated $65,800 million in December 2027. This suggests expanding operations and higher costs associated with business growth. Among these, SG&A Expenses, including Selling & Marketing Expenses, Salaries & Benefits, and Research & Development, also rose over the years, signaling investments in personnel, marketing, and innovation. However, despite higher costs, Operating Income improved significantly, climbing from $15,438 million in December 2023 to $21,575 million in December 2027, indicating better cost management and efficiency.
The company faces Provision for Credit Losses, increasing from $4,923 million in December 2023 to $6,677 million in December 2027, possibly reflecting increased lending activities and higher risk exposure. Despite this, net income (GAAP) grew from $8,374 million in December 2023 to $11,967 million in December 2027, and earnings per share (EPS) followed a similar trend, signaling overall financial strength and profitability improvements.
Overall, the projections indicate strong revenue growth, improved margins, and expanding business operations. However, rising expenses and credit loss provisions highlight the need for effective cost control and risk management strategies to sustain profitability in the long run.
6.4.2 Balance Sheet
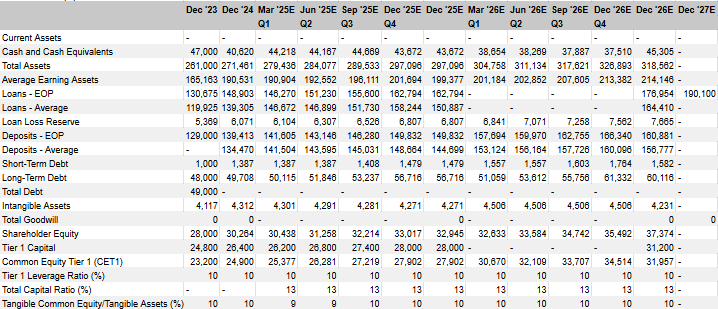
The financial analysis of the company’s balance sheet and capital adequacy ratios indicates strong growth and stability, though some risks need to be monitored. Total assets are projected to grow steadily from €261 billion in Dec '23 to €328.9 billion by Dec '26E, reflecting business expansion. Meanwhile, cash and cash equivalents fluctuate, decreasing from €47 billion in Dec '23 to €37.5 billion in Dec '26E before rebounding to €45.3 billion in Dec '27E. This suggests variability in liquidity management, possibly due to shifting funding strategies or investment allocations. Additionally, average earning assets (which include interest-generating loans and investments) rise consistently, from €185.1 billion in Dec '23 to €214.1 billion in Dec '26E, aligning with overall asset growth.
The company’s loan portfolio is expanding significantly, with loans (end-of-period, EOP) growing from €119.9 billion in Dec '23 to €164.4 billion in Dec '26E. Similarly, deposits (EOP) increased from €129 billion to €160.8 billion over the same period. However, the loan growth rate is outpacing deposit growth, which could put pressure on liquidity and funding costs. At the same time, the loan loss reserve rises from €5.38 billion in Dec '23 to €7.58 billion in Dec '26E, suggesting that the company is taking a cautious approach to potential credit risks.
Debt levels are also increasing, with total debt rising from €48 billion in Dec '23 to €55.2 billion in Dec '26E. While short-term debt remains relatively stable at around €1 billion to €1.5 billion, long-term debt grows from €48 billion to €53.8 billion. This increase in leverage could indicate funding needs to support loan growth, but it also introduces financial risk, particularly if interest rates rise.
Despite rising debt, the company maintains a strong capital position. Shareholder equity increased from €28 billion in Dec '23 to €37.3 billion in Dec '26E, supported by retained earnings and potential capital injections. Common Equity Tier 1 (CET1) Capital follows a similar trajectory, growing from €23.2 billion to €31.9 billion, ensuring regulatory compliance and financial stability. The Tier 1 Leverage Ratio remains stable at 9-10%, while the Total Capital Ratio stays consistent at 10%, indicating that the company is managing its capital prudently.
Tangible common equity remains robust, with the Tangible Common Equity/Tangible Assets ratio holding at 10% throughout the forecast period. Intangible assets fluctuate slightly between €4.3 billion and €4.5 billion, while goodwill is projected to phase out by Dec '27E, further strengthening the balance sheet. This stability in tangible equity provides a strong buffer against potential financial downturns.
Overall, the company is experiencing steady asset and loan growth, backed by strong capital adequacy ratios and prudent risk management. However, there are potential risks, including loan growth outpacing deposits, which could create funding gaps, rising debt levels, which may increase financial vulnerabilities, and fluctuating cash reserves, which need to be carefully managed to maintain liquidity. While the company is on a strong financial trajectory, close monitoring of its funding structure and risk exposure will be crucial for sustained long-term stability.
6.4.3 Cash Flow Statement

The company's capital expenditures (CapEx) appear to be minimal, with only €1.565 billion recorded in Dec '23 and no further projections for the following years. This suggests that the company is not planning significant infrastructure or operational investments, which could indicate a mature business model or a strategic shift toward cost efficiency rather than expansion.
Cash flow from financing remains unreported, implying that the company is either self-sustaining through internal cash flows or using alternative financing methods that are not explicitly detailed in this dataset. However, the share repurchase activity is notable, with €3.338 billion spent in Dec '23, followed by a significant €5.9 billion repurchase in Dec '24. In 2025, the company plans smaller but consistent repurchases of €1.3 billion per quarter, amounting to €5.2 billion in total for the year. Interestingly, another large repurchase of €8 billion is projected for Dec '27E, suggesting a focus on returning value to shareholders rather than reinvesting in growth.
On the credit quality front, non-performing assets (NPAs) as a percentage of loans and other real estate owned (OREO) remain unreported until Dec '25E, when they are expected to reach 1% and stay at that level through Dec '27E. This suggests that the company anticipates some credit risk materializing but remains within manageable levels. Maintaining NPAs at 1% indicates a relatively stable loan portfolio with limited deterioration in asset quality, aligning with the increasing loan loss reserves observed in the previous table.
Overall, the company appears to be prioritizing shareholder returns through buybacks rather than capital investments, which could signal confidence in existing operations or a lack of high-return investment opportunities. The anticipated stabilization of NPAs at 1% suggests prudent credit risk management, though the absence of reported financing activities raises questions about how the company will support its capital allocation strategies in the long term.
6.4.4 Per Share
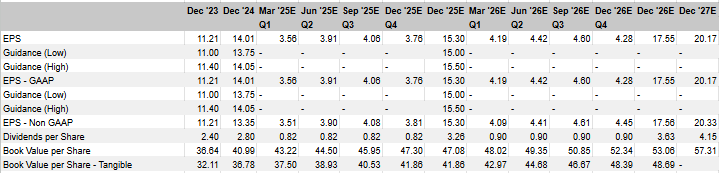
The company's Earnings Per Share (EPS) has shown steady growth, increasing from €11.21 in Dec '23 to €14.01 in Dec '24. However, for 2025, quarterly EPS is expected to drop significantly, starting at €3.56 in Q1 and peaking at €4.08 in Q3, before recovering to €20.17 by Dec '27E. This decline in 2025 suggests temporary headwinds, possibly due to market conditions, investment cycles, or operational challenges.
The EPS guidance also reflects this pattern, with the low-end projection at €13.75 and the high-end at €15.50 for Dec '25. The company's GAAP EPS follows the same trajectory as the reported EPS, with non-GAAP EPS slightly higher throughout the periods. The discrepancy between GAAP and non-GAAP figures suggests adjustments related to non-recurring items, such as restructuring charges, stock-based compensation, or other expenses that management believes do not reflect ongoing business performance.
Dividend per share remains relatively stable, starting at €2.40 in December '23, then slightly decreasing to €2.80 in December '24 and €0.82 per quarter from March '25 onward. A slight increase to €3.30 in December '26 and €4.15 in December '27 indicates an improving capital return policy, possibly reflecting anticipated earnings recovery and a stronger financial position.
The Book Value per Share (BVPS) has shown consistent growth, rising from €38.64 in Dec '23 to €42.97 in Dec '26, with a projected increase to €57.31 by Dec '27E. The tangible book value per share follows a similar trend, reinforcing the idea that the company is accumulating tangible assets and improving shareholder equity.
Overall, the financial outlook suggests a temporary decline in EPS during 2025, potentially due to strategic investments or short-term headwinds. However, long-term growth prospects remain strong, as reflected in the rising book value and dividend per share. The company appears to be positioning itself for sustainable growth and increased shareholder returns in the coming years.
6.4.5 Valuation Metrics

The Price-to-Earnings (P/E) ratio is expected to fluctuate over the years, rising from 16.7 in Dec '23 to 21.2 in Dec '24 before gradually declining to 13.0 by Dec '27E. This trend suggests that the market initially assigns a higher valuation multiple, possibly due to growth expectations, before adjusting to a lower multiple as earnings stabilize or grow.
Book Value (BV) Growth remains positive, with a growth rate of 11.9x in Dec '24, peaking at 14.9x by Dec '25E and settling at 14.3x in Dec '27E. This consistent increase in book value aligns with rising shareholder equity and retained earnings, indicating a strengthening financial position.
The PEG Ratio (Price/Earnings Growth) and its variations for operating earnings and net income exhibit high values initially, with the PEG Ratio (Operating) at 121.0 in December '23 and decreasing to 100.9 by December 27E. A declining PEG ratio suggests that the company's earnings growth is beginning to catch up with its valuation, making it potentially more attractive for investors over time.
The Price-to-Book Value (P/B) ratio fluctuates within a narrow range, rising from 5.1 in Dec '23 to 7.2 in Dec '25E, then stabilizing around 5.0 in Dec '27E. Similarly, the Price-to-Sales (P/S) ratio shows modest variations, reaching a high of 3.2 in Dec '24 before decreasing to 2.4 in Dec '27E, reflecting a more reasonable valuation as sales grow.
The Enterprise Value (EV) to Sales and EBIT multiples suggest a steady valuation trend, with EV/Sales ranging between 2.3x and 2.8x and EV/EBIT moving between 9.1x and 12.1x. These figures imply that while the company maintains a strong earnings base, market sentiment, and external conditions may impact valuation multiples over time.
The Dividend Yield (%) remains relatively stable, fluctuating between 0.8% and 1.2%, suggesting a consistent dividend policy aligned with earnings. Meanwhile, Sales per Share follows an increasing trajectory, rising from 6.6 in Dec '23 to 8.9 by Dec '27E, reinforcing revenue growth expectations.
Regarding profitability, Return on Assets (ROA) remains within the 3.2%-3.8% range, while Return on Equity (ROE) strengthens from 30.3% in Dec '23 to 35.2% by Dec '27E. This indicates that the company is becoming increasingly efficient at generating profits from shareholders’ equity.
Operating and Net Income Returns on Assets and Shareholders’ Equity remain consistent, with Net Income Return on Assets holding at 0.3% across the forecast period and Net Income Return on SH Equity climbing to 0.7% in Dec '27E. This signals steady financial performance despite market fluctuations.
Overall, the financial metrics indicate moderate valuation adjustments, strong profitability, and steady book value growth, positioning the company well for long-term financial stability and shareholder value appreciation.
7. Risks and Mitigation
7.1 Risks
7.1.1 Increasing Competitive Landscape
American Express, a prominent player in the global payments landscape, faces many risks that could significantly impact its financial performance and long-term stability. The intense competitive landscape poses a substantial threat. The payments industry is a battleground, with established giants like Visa and Mastercard constantly innovating and agile fintech companies disrupting traditional models with lower fees and novel technologies. These fintech challengers are particularly adept at leveraging digital platforms and data analytics to offer personalized services and streamlined user experiences. This competitive pressure could lead to pricing pressures, reduced market share, and increased customer acquisition costs for Amex, requiring continuous adaptation and strategic investment to maintain its position.
7.1.2 Susceptibility to Economic Downturns
Furthermore, the company's susceptibility to economic downturns presents a significant vulnerability. Amex's business model, mainly focusing on affluent consumers, is inherently linked to discretionary spending. During economic recessions or periods of high inflation, consumers tend to curtail spending, especially on non-essential items like travel and entertainment, which are core components of Amex's transaction volume. Rising unemployment and reduced consumer confidence can lead to increased credit defaults and a decline in overall transaction activity, directly impacting Amex's revenue and profitability. The economy's cyclical nature necessitates robust risk management strategies and contingency plans to mitigate the impact of adverse economic conditions. Indeed, credit risk is an inherent part of Amex's business as a card issuer. The company faces the risk of card member defaults, particularly during economic downturns or periods of financial distress. The quality of Amex's credit portfolio and its ability to manage credit risk are critical to its financial stability. Ineffective credit risk management can lead to substantial losses and impact the company's profitability. Similarly, fluctuations in interest rates can affect Amex's profitability. Rising interest rates can increase borrowing costs, potentially leading to higher credit card defaults. Amex must carefully manage its interest rate risk and adjust its lending practices accordingly to maintain its financial stability. Lastly, while diversifying, the company's reliance on travel and entertainment (T&E) spending still presents a risk. Global events like pandemics, geopolitical instability, or natural disasters can disrupt travel patterns and significantly impact Amex's transaction volumes. The volatility of the T&E sector requires Amex to diversify its revenue streams and develop strategies to mitigate the impact of unforeseen events.
7.1.3 Cybersecurity Breaches & Regulatory Scrutiny
Cybersecurity and data breaches pose a growing threat to Amex's operations and reputation. As a custodian of vast amounts of sensitive customer data, Amex is a prime target for cyberattacks. A successful data breach can result in financial losses, legal liabilities, and reputational damage. The increasing sophistication of cyber threats requires Amex to invest heavily in cybersecurity infrastructure and implement robust data protection measures. The company's ability to maintain customer trust and safeguard sensitive information is crucial for its long-term success. Similarly, because of the growing threats of cybersecurity and data breaches, the financial services industry is subject to stringent regulations designed to protect consumers and maintain market stability. Changes in rules, such as those related to interchange fees, data privacy, and anti-money laundering, can impose significant compliance costs and operational challenges for Amex. Increased regulatory scrutiny can also lead to investigations, fines, and reputational damage. The evolving regulatory landscape, particularly in open banking and cross-border payments, requires Amex to maintain a proactive approach to compliance and engage with regulators to ensure its business practices align with evolving standards.

7.2 Mitigation
7.2.1 Fortifying Competitive Advantage in a Dynamic Market
American Express recognizes the imperative to adapt and lead within the fiercely competitive payments landscape. To achieve this, the company is embarking on a hyper-personalization strategy, leveraging its vast data resources to create uniquely tailored experiences for each customer. This extends beyond simple rewards programs to encompass predictive analytics anticipating needs, offering proactive solutions and bespoke recommendations. Strategic partnerships and targeted acquisitions within the fintech sector are being pursued to integrate cutting-edge technologies and expand Amex’s reach into emerging market segments. The company is also committed to building a robust and intuitive digital ecosystem, seamlessly integrating its services with third-party applications through open APIs. Emphasizing its premium brand, Amex focuses on niche markets, delivering exclusive, high-value services that distinguish it from mass-market competitors. These comprehensive efforts, ranging from advanced data analytics to strategic collaborations, ensure that Amex survives and thrives in a rapidly evolving market.
7.2.2 Building Economic Resilience Through Diversification and Proactive Risk Management
American Express is acutely aware of its susceptibility to economic fluctuations and is implementing a multi-faceted approach to enhance its resilience. Diversification of revenue streams is a cornerstone of this strategy, focusing on expanding its commercial and merchant services segments to reduce reliance on consumer spending. Dynamic credit risk management is being implemented, employing real-time monitoring and stress testing to adapt to changing economic conditions. Proactive customer engagement is prioritized, offering flexible payment options and financial education resources during downturns. Countercyclical investment strategies are being explored, leveraging economic downturns as opportunities for strategic acquisitions and research and development. This comprehensive approach, combining diversification with proactive risk management, aims to minimize the impact of financial volatility and ensure long-term stability.
7.2.3 Enhancing Digital Fortress: Proactive Defense Against Evolving Cyber Threats
In an era of escalating cyber threats, American Express is fortifying its digital defenses through a multi-layered security strategy. The company is implementing a zero-trust security architecture, assuming no user or device is inherently trustworthy, and employing continuous authentication and monitoring. Advanced threat intelligence capabilities are being developed, leveraging AI and machine learning to detect and respond to cyber threats in real time. A culture of cybersecurity awareness is being fostered through comprehensive employee training and education. Robust data encryption and privacy controls are being implemented to protect sensitive customer information, aligning with global data privacy regulations. Regular penetration testing and security audits are conducted to identify vulnerabilities and ensure the effectiveness of security measures. This holistic approach, encompassing technology, training, and continuous monitoring, aims to create a robust digital fortress against evolving cyber threats.
7.2.4 Navigating Regulatory Complexity: Fostering a Culture of Compliance and Trust
Recognizing the intricate regulatory landscape, American Express is adopting a proactive and transparent approach to compliance. Enhanced regulatory intelligence capabilities are being developed to track and analyze regulatory changes across jurisdictions. Open communication channels are established with regulators, fostering dialogue and providing feedback on proposed regulations. Compliance processes are being automated to reduce the risk of human error and ensure consistent adherence to regulatory requirements. Comprehensive ethics and compliance training is provided to employees, reinforcing the importance of ethical conduct. An independent compliance monitoring function is established to assess the effectiveness of compliance programs. This commitment to transparency, collaboration, and continuous improvement aims to build trust with regulators and stakeholders, ensuring Amex operates within the bounds of evolving regulatory standards.
8. ESG Assessment
Although primarily a financial services provider, American Express demonstrates a clear commitment to integrating environmental responsibility into its strategic operations. The company is actively working to reduce its impact on the planet through various initiatives. These efforts encompass a broad spectrum, from transitioning to cleaner energy sources to optimizing the efficiency of their existing infrastructure. They strongly focus on minimizing waste and promoting responsible resource management throughout their operations. Furthermore, the company engages with its supply chain to encourage more sustainable practices. This holistic approach signals a dedication to improving environmental performance and contributing to a more sustainable future.

8.1 Environmental Assessment
American Express is actively working to minimize its environmental footprint with a strong focus on renewable energy. For example, in 2022, they achieved 100% renewable electricity for their U.S. operations by investing in renewable energy certificates (RECs) and signing power purchase agreements (PPAs) with wind and solar farms. They have also implemented energy-efficient technologies in their data centers, such as advanced cooling systems, leading to a 15% reduction in energy usage. American Express publicly reports its Scope 1, 2, and 3 greenhouse gas emissions to ensure transparency. The company is working with suppliers to reduce their carbon footprints, aiming for 60% of key suppliers to set science-based targets by 2025. Additionally, they have introduced recycling programs in offices and data centers, achieving a 90% waste diversion rate at their New York headquarters. In 2022, American Express launched its Sustainability Financing Framework. It issued $1 billion in Sustainability Notes to fund renewable energy projects, energy-efficient buildings, and initiatives supporting financial inclusion, aligning with its broader ESG strategy.
8.2 Social Assessment
American Express is strongly committed to social responsibility, focusing on diversity, inclusion, and community engagement. For instance, the company actively promotes diversity through Employee Resource Groups (ERGs) and publishes its Global Diversity & Inclusion Report, highlighting efforts to improve representation across all levels. They have also implemented equal pay initiatives and career advancement programs to ensure a fair workplace. In 2023, the American Express Foundation granted over $48 million to support nonprofit organizations focused on education, disaster relief, and economic development. Additionally, Amex supports small businesses through initiatives like "Shop Small" and the Backing Small Businesses grant program, which, in partnership with Main Street America, provides grants, mentoring support, and technical assistance to economically vulnerable and under-resourced small businesses with community significance. From 2021 through 2023, American Express has also made or committed approximately $1.1 billion in investments and community development loans. Moreover, the company invests significantly in cybersecurity technologies to protect customer data, complying with regulations like GDPR and CCPA. To uphold ethical practices, Amex maintains a code of conduct and provides a whistleblower hotline for employees to report concerns confidentially.
8.3 Governance Assessment
American Express maintains a robust governance framework with a Board of Directors comprised of independent directors who bring diverse expertise in areas such as finance, technology, and risk management. The board operates through specialized committees, including the Audit Committee, which oversees financial reporting and compliance; the Compensation and Benefits Committee, responsible for executive compensation policies; and the Nominating and Governance Committee, which ensures effective board composition and practices. Amex has documented policies for risk management, internal controls, and compliance to uphold high standards of corporate governance. For example, the company employs enterprise risk management (ERM) processes to assess and mitigate financial and operational risks systematically. Amex provides detailed financial disclosures through SEC filings such as 10-K and 10-Q reports and hosts annual shareholder meetings to maintain transparency. Additionally, Amex publishes its Corporate Governance Guidelines on its investor relations website, ensuring easy access to governance practices and policies. The company also has a strong code of conduct with anonymous whistleblower mechanisms to report ethical concerns. As a result of these practices, Amex consistently receives favorable ratings from governance rating agencies like ISS Governance QualityScore and MSCI ESG Ratings.
9. Conclusion
In conclusion, American Express presents a compelling investment opportunity within the dynamic global payments market. The company’s unique closed-loop network, robust brand recognition, and focus on affluent clientele create a distinct competitive advantage. Amex's strategic investments in digital transformation, coupled with its proactive engagement with the fintech ecosystem, position it to capitalize on the accelerating trends of digital payments and e-commerce growth. Despite facing challenges from increased competition, economic uncertainties, and evolving regulatory landscapes, Amex's robust risk management strategies, commitment to cybersecurity, and proactive compliance measures mitigate these potential headwinds. Furthermore, Amex's increasing focus on environmental and social responsibility demonstrates a commitment to creating sustainable long-term value. The company's consistent financial performance and shareholder-friendly capital allocation policies reinforce its appeal as a stable and growth-oriented investment. While thorough due diligence and a comprehensive valuation analysis are essential, American Express demonstrates the potential for significant long-term returns, making it a worthy consideration for investors seeking exposure to the thriving global payments sector.