


Initial Report: EZCORP Inc. (NASDAQ: EZPW), 108% 5-yr Potential Upside (Olivia ZHANG, SC VIP)
Olivia ZHANG presents a "BUY" recommendation for EZCORP Inc. based on its robust profitability, improving cost efficiency, and growth prospects in Latin America.


1 Executive Summary
My initial rating on Ezcorp is “Buy” and the 1Yr Target price is $22.64 (IRR is 54.5%). EZPW's stock maintains high momentum in this volatile market, and if you don't believe in the U.S. market, then believe in EZcorp. The reasons are: 1) Pawn loan demand has huge growth potential, which will drive Pawn Service charges (PSC); 2) Latin America has plenty of room for expansion and penetration in a vibrant pawn loan and second hand market; and 3) EZcorp's store expense is getting efficient, which are improving its margins. I don't think EZPW's growth will stop and it will continue to grow steadily in this uncertain market.
2 Company Overview & Business Model
Ezcorp is a multinational financial services company specializing in pawn loans, second-hand goods sales, and precious metal scrap recovery. Its core business model revolves around generating stable cash flow through Pawn Loan Outstandings (PLOs). The company provides short-term cash loans secured by tangible assets such as jewelry and electronics, charging Pawn Service Charges (PSC), which function similarly to interest income. If a customer defaults, the pledged items become inventory and are liquidated through retail sales or precious metal recycling. Ezcorp operates primarily in the United States, Mexico, and other Latin American regions, continuously expanding its market presence through strategic acquisitions, such as the purchase of Presta Dinero in Mexico.
1) Pawn Loan Outstanding (PLO)and Pawn Service Charges (PSC)- 38% of revenue
PLO is the core financial service offered by EZcorp, allowing customers to use tangible personal assets as collateral in exchange for cash loans. The PSC functions similarly to loan interest, with rates varying by state and transaction size.
PSC rates are typically regulated by legal and regulatory frameworks, differing across countries, states, and regions. In the U.S., pawn loans are overseen by state governments, with PSC rates often subject to caps depending on state laws. For example, in Texas, the small loan limit increased from $201 in 2016 (240% APR) to $264 in 2025 (240% APR). For loans between $201.01 - $1,340, the APR was 180% in 2016, which later increased to $264.01 - $1,760 (180% APR). In Florida, PSC rates can go as high as 25% per month [1] [2].
In the U.S., PSC rates typically range from 12% to 25% per month, with pawn loan terms generally lasting 30 to 90 days. The average loan amount per transaction is approximately $170 to $200. [3]
In Mexico, under local regulations, PSC rates usually range from 15% to 21% per month, with pawn terms generally set at 30 days. The average loan amount per transaction is around $65 to $85. [3]
In other Latin American regions, PSC rates typically range from 12% to 18% per month, with pawn terms also set at 30 days. The average loan amount per transaction is $120 to $140, which is higher than in Mexico due to a greater proportion of jewelry as collateral. [3]
Customers have the option to redeem their collaterals by repaying the loan principal along with accrued interest. If they choose not to redeem, the collateral is transferred to the company’s inventory and sold through retail channels or recycling. Growth in PLO typically will drive an increase in PSC, which is a larger loan portfolio resulting in higher interest income for the company.
Collateral is generally categorized into two main types:
General Merchandise Goods, which include household appliances, mobile phones, clothing, luxury etc.
Jewelry, which includes items like gold and other precious jewelry.
Jewelry typically secures higher PLO amounts, has a lower default rate compared to general merchandise goods, and offers higher market liquidity. In 2024, the collateral structure in the U.S. market consisted of 66% jewelry and 34% merchandise goods. In contrast, in Latin American markets, the structure was reversed, with 36% jewelry and 64% merchandise goods making up the majority.

According to the 2025 Q1 quarterly results, the collateral structure composition improved in both the U.S. and Latin American markets.
In the U.S., the jewelry composition increased by 60 bpt, driven by higher jewelry volume and rising gold prices.
In Latin America, the jewelry composition rose by 400 bpt, reflecting an operational focus on expanding this category, particularly in Mexico.

In FY 2024, PSC revenue delivered strong performance, reaching $437 million, a 14% YoY increase, contributing 38% of total revenue. The primary driver of this growth was the increase in PLO ( 21% yoy, $545M), which led to higher PSC income.
In 2020, PLO declined 26% YoY due to the pandemic, resulting in a 17% YoY drop in PSC revenue. However, post-pandemic, from 2021 to 2024, PLO demand rebounded significantly.
PLO 5-yr CAGR (2020-2024): 10.4%
PSC 4-yr CAGR (2021-2024): 13.8%
PSC revenue as a percentage of total revenue has now returned to pre-pandemic levels, and even more than that. However, growth dynamics remain, which will be further explained later.
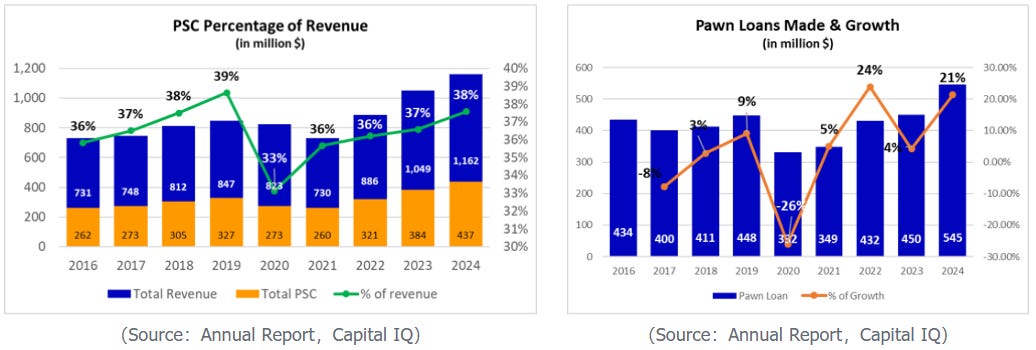
Strong consumer demand, increases in average loan size, and improved customer service continue to drive PLO growth, leading to a record-high balance of $282.9 million, up 16% YoY in 25Q1. PSC revenue reached $119.9 million, up 13% YoY, primarily driven by same-store PLO growth in 25Q1. [4]

PSC Yield represents the interest income capability of pawn loans, indicating the percentage of PSC earned from each unit of newly issued pawn loans (See calculated function in Appendix). EZcorp’s PSC Yield has seen a significant increase, suggesting that its pawn loan business benefits from high interest rates and strong pricing power. At the same time, PLO volume has been expanding, while maintaining an 80% PSC Yield in 2024, demonstrating the strong profitability of its PLO-PSC business model. Additionally, since PSC revenue has no COGS, its profitability is exceptionally high, which will be reached further in the following content.

2) Merchandise Sales - 57% of revenue
Ezcorp’s second core business is the sale of second-hand goods, including jewelry, electronic products, and more. These items come from forfeited pawned collateral or are directly purchased from customers as used merchandise. Since second-hand products are priced significantly lower than their original retail value, they attract value-conscious customers—consumers who prefer affordable yet functional items over paying a premium for brand-new products. In times of high inflation or economic downturns, this business model becomes even more appealing, as more consumers look for cost-effective shopping options to stretch their budgets.
The business model of merchandise sales is quite interesting.
Customers use tangible assets such as jewelry and electronic products as collateral to PLO. In the financial statements, PLO is recorded as "pawn loan" or "note receivable," classified as a current asset because these loans are generally short-term (typically 30-90 days). As long as the loan is not in default (Active Loan), the ownership of the collateral still belongs to the customer, and EZCorp only temporarily holds these assets as security. Due to accounting principles, EZCorp cannot record assets it does not truly own on its balance sheet, so collateral does not appear in the company’s financial statements. Once the customer fails to redeem the collateral (loan default), EZCorp officially gains ownership. At this point, the collateral transitions from being the customer’s asset to EZCorp’s inventory (Merchandise Inventory) and is recorded as inventory on the balance sheet.
When collateral is converted into inventory, its recorded value is determined using the Lower of Cost or Market (LCM) method:
If the market value is greater than or equal to the pawn loan principal, the inventory value is recorded as the pawn loan amount.
If the market value is lower than the pawn loan principal, the inventory value is recorded as the market value, and the pawn shop must recognize a depreciation in the financial statements.
For PSC (Pawn Service Charges):
If the customer redeems the collateral (Active Loan), the PSC is recorded as revenue, similar to interest income.
If the customer defaults (Forfeited Collateral), the PSC is included as inventory cost (COGS) because the pawn shop can no longer collect this fee, which reduces profit.
Therefore, when EZCorp sells inventory (forfeited collateral), the COGS consists of two components:
The book value of inventory (determined as the lower of the PLO amount or market value).
The uncollected PSC.
When inventory is sold, the selling price is typically higher than the recorded cost, generating profit. If we analyze the gross margin of the merchandise sales segment, it is 36%. Based on market data, the PLO principal is usually set at 30%-70% of the collateral’s second-hand market value, depending on the collateral type. Among the recorded inventory value, approximately 5% comes from forfeited PSC.
(*Pawn Loans Forfeited and Transferred to Inventory is the inventory's total COGS which consists of 95% of inventory book value and 5% of forfeited PSC)

By calculating Ezcorp’s forfeited rate, I can measure the percentage of PLO that are ultimately not redeemed by customers and instead default into the company’s inventory (forfeited collateral). Excluding the 2020 pandemic impact, Ezcorp’s forfeited rate has averaged around 40%, which is relatively high. This also reflects economic downturns, but I believe a high default rate is not necessarily a bad thing.
The key metric to assess is the recovery rate, which measures the percentage of the loan that the shop can get back by selling the pledged item if the borrower doesn’t repay. After the pandemic, Ezcorp’s recovery rate has averaged 1.83x, indicating strong merchandise sales profitability. This means most forfeited items are sold at a price significantly higher than the original PLO amount . Ezcorp’s high forfeited rate, combined with a high recovery rate, creates substantial value in merchandise sales and demonstrates the company’s pricing power in the second-hand market.
Merchandise sales = Pawn loans x forfeited rate x recovery rate

The merchandise sales business model operates on a “localized sales” approach. Ezcorp’s stores themselves function as the supply chain for merchandise sales. Each store operates independently, unlike traditional retailers that rely on centralized warehouses or national supply chains. Instead, pawnshop inventory comes directly from customers:
Customers pawn items for a loan, and if they fail to redeem them, these items become inventory for sale.
Customers can also sell second-hand items directly to the store, which are then resold within the same location.
In most cases, merchandise remains in the same store where it was received rather than being sent to a central warehouse for redistribution. This means Ezcorp’s business does not require large-scale supply chain operations or warehouse management costs. Compared to traditional retailers like Walmart or Best Buy, which require nationwide logistics, warehousing, and distribution systems, the pawn industry operates differently, offering several key advantages:
Fast inventory turnover: Inventory is sourced directly from customers, rather than through bulk purchases from suppliers.
Lower logistics and storage costs: The company does not need to invest heavily in distribution centers or warehouses, reducing operational expenses.
Greater flexibility: Stores can adjust inventory based on local demand without waiting for nationwide supply chain adjustments.
3) Jewelry Scrapping Sales – 5% of revenue
The jewelry scrapping business primarily deals with gold or jewelry that has low market demand or unsellable inventory. Instead of selling these items as second-hand products, Ezcorp extracts and refines the precious metals, then sells them to manufacturers or jewelers to realize the raw material value.
This business is highly dependent on fluctuations in precious gold prices. When gold prices rise, the company can generate higher returns from scrapping. In 2024, jewelry scrapping sales reached $61M, reflecting a 23% YoY growth, with a historical 3-year CAGR of 24%. The key drivers of this growth include:
Gold price appreciation, which increased the resale value of scrapped jewelry.
Changes in collateral structure, with a higher proportion of jewelry in the company’s inventory mix, leading to more available materials for scrapping.
3 Investment Thesis
3.1 Financial Analysis - Ezcorp's business profitability and growth momentum remain strong. Operating expense efficiency is gradually improving, while operational efficiency continues to show significant gains.
The financial picture of EZcorp demonstrates robust profitability and improving cost efficiency, even when compared to a larger competitor such as FirstCash. Analyzing the key metrics reveals a company with a stable gross margin, strong operating and net income margins, and notable year-over-year growth. This in-depth analysis will explore these financial dimensions and highlight how the company’s operational improvements and cost management strategies are reinforcing its market position.
1) Revenue and Growth Trends
In fiscal year 2024, Ezcorp reported total revenues of $1,162 million, marking an 11% YoY growth. This growth was primarily driven by rising demand for PLOs in 2024, leading to a 14% increase in PSC revenue, while strong gold prices contributed to a 23% increase in jewelry scrapping revenue.
Gross profit for the year reached $682 million, reflecting a 12% YoY increase, demonstrating the company’s ability to convert both merchandise sales and PSC collections into stable and improving gross margins.
A particularly notable highlight is net income, which surged to $83 million in 2024, compared to $38.5 million in 2023, representing a 116% YoY increase. This sharp rise in profitability, while maintaining industry-average operating margins, underscores effective cost management and operational improvements, significantly enhancing Ezcorp’s bottom line.
2) Strong Profitability and Margin Stability
Over recent years, EZcorp has maintained a very high gross margin of approximately 60%. This indicates that the company is effective at pricing strategies related to merchandise, PLO and Pawn rate, allowing it to generate a significant profit in businesses even before accounting for operating expenses. The operating profit margin of around 10% and a net income margin of 7% are consistent with industry average benchmarks, demonstrating that EZcorp’s overall cost structure and operational execution are on par with the market.

(Source: Annual Report, Capital IQ)
What is particularly noteworthy is the comparison with FirstCash. Despite FirstCash’s scale is three times that of EZcorp, FirstCash operating margin stands at 13.3%. This is only modestly higher than EZcorp’s (10%), suggesting that while FirstCash may benefit from economies of scale, EZcorp is able to generate competitive profitability relative to its size. Moreover, the net income margins of both companies are similar (approximately 7.2% for EZcorp and 7.6% for FirstCash), underscoring that EZcorp’s profitability is strong. With a dramatic increase in net income, while the operating margins remain in line with industry averages, points to effective cost management and operational improvements that have amplified profitability.

(Source: Annual Report, Capital IQ)
3) Cost and Expense Dynamics
The detailed breakdown of key expenses provides further context:
COGS: $729 million, growing at 9% YoY.
Store Expense: $269 million, growing at 10% YoY.
General Sales & Administration (GS&A): $171 million, with a YoY growth of 12%.
Depreciation & Amortization (D&A): $192 million, with a modest YoY increase of 3%.
The Cost of Goods Sold (COGS) accounts for approximately 40% of total revenue, a figure that reflects the significant role merchandise sales play in the business. Within this COGS structure, 90% is derived from merchandise sales and only 10% from jewelry scrapping. PSC doesn’t have COGS, which is one of drivers behind the impressive gross margins.

4) Efficiency Improvements and Strategic Implications
The major component of operating expenses is the store expense, which also represents about 40% of revenue. This high proportion is largely attributable to EZcorp’s direct-operated store model. While a higher store expense might initially seem like a drawback, the company is demonstrating marked improvements in expense efficiency. The analysis of the PSC revenue (related to store performance) shows an improvement in covering store expenses. Specifically, the PSC cover expense rate improved from -27% in 2021 to -6% in 2024. This narrowing gap between PSC revenue and store expense indicates that individual stores are becoming more cost-efficient, ultimately enhancing the overall profitability of the company.
The evolution of the PSC cover expense rate is particularly significant. As the gap between PSC revenue and store expense narrows, it is evident that EZcorp’s individual store operations are becoming more efficient over time. In other words, the cost per store is decreasing relative to the revenue generated, which bodes well for scalability and profitability in the long run. This efficiency not only boosts the margins at the store level but also contributes to a stronger overall operating performance.
Given that EZcorp operates a direct-operated model, the focus on optimizing store expense is critical. While the high proportion of store expense might initially raise concerns, the company’s ability to tighten this margin through operational improvements suggests that the business model is maturing. As these efficiencies continue to materialize, EZcorp may find itself in an even more competitive position relative to larger players like FirstCash, who, despite benefiting from scale, may not be experiencing the same level of per-store cost improvements.

(Source: Annual Report,Capital IQ)
3.2 Merchandise sales pricing lacks transparency, allowing for internal control over goods pricing, which leads to higher profit margins. Meanwhile, PLO-PSC revenue has no COGS, making it pure gross profit.
Collateral pricing in pawn transactions lacks transparency, allowing Ezcorp to set price at a premium. The company's recovery rate is approximately 1.8x aforementioned, while loan amounts are typically set at around 60% of the collateral’s secondary market value.
In the U.S. market, jewelry accounts for 66% of Ezcorp’s pledged collateral, making the business influenced by gold prices. This is particularly beneficial during economic downturns when gold tends to retain or appreciate in value. Additionally, the demand for secondhand goods continues to rise, driven by factors such as economic downshifting and global tariff wars, which have accelerated price inflation. As a result, secondhand markets are becoming increasingly attractive to consumers.
Ezcorp’s merchandise sales business demonstrates several key characteristics that contribute to its profitability and resilience. One of its most significant advantages is the opaque pricing of collateral, which allows the company to achieve high profit margins upon resale. This pricing opacity arises from the nature of pawned goods, where valuation is subject to internal expertise, enabling Ezcorp to maximize margins. Moreover, the company consistently maintains a high recovery rate (1.8x), ensuring profitability even as the forfeited rate remains around 40%. This strong recovery rate underscores the efficiency of Ezcorp’s pricing strategy and liquidation processes, which allow it to swiftly convert forfeited goods into cash, maintaining liquidity and reducing inventory risks.
The composition of collateral also plays a crucial role in the business model's strength. In the U.S. market, 68% of pawned items are jewelry, making Ezcorp particularly well-positioned to benefit from macroeconomic trends such as rising gold prices during economic downturns. This countercyclical advantage provides a natural hedge against recessions, as increased gold valuations enhance the resale value of forfeited jewelry.
Furthermore, the second-hand retail market in both the U.S. and Mexico remains robust, with 60% of second-hand purchases in the U.S. and 59% in Mexico[5]. These figures highlight the significant potential for further market penetration, particularly as sustainability trends and cost-conscious consumer behavior drive demand for second-hand goods.

(Source: Statista 2024 [5] )
Beyond merchandise sales, Ezcorp’s PLO and PSC business exhibit exceptional profitability, primarily due to the high-margin nature of PSC revenues. Unlike merchandise sales, PSC has no COGS, making it a pure gross margin revenue stream. This structural advantage is reflected in its substantial contribution to total profitability—PSC accounts for 64% of Ezcorp’s total gross margin, while merchandise sales contribute 34.6%. These dynamic underscores the efficiency and scalability of the company’s lending model. Since pawn loans are secured by collateral, default risks are mitigated, and forfeited assets can be resold at a high margin, reinforcing the business’s resilience.
The contribution of gross margin from business segments
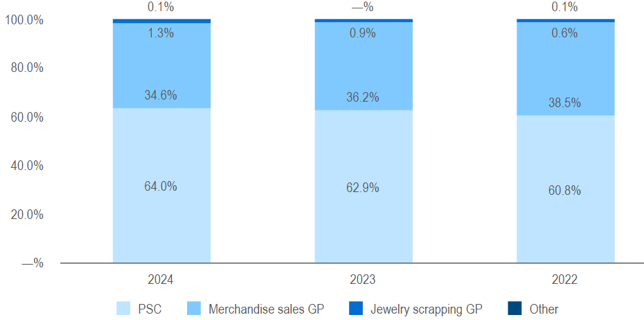
(Source: Annual Report[3])
3.3 The U.S. market has reached near saturation in store penetration, yet continued demand for PLO remains a key driver of revenue growth. In contrast, the Latin American market presents strong growth potential, with significant untapped opportunities, positioning it as a key growth driver for Ezcorp’s future expansion.
1)The US market
As of September 2024, there are a total of 7,771 pawn stores in the United States, with the majority being family-owned or small businesses [12]. Consequently, the market for pawn stores is highly fragmented. Ezcorp, which currently operates 542 locations across the country, has significant acquisition potential. Its largest competitor, FirstCash, operates approximately 3,000 stores in the U.S [12].
The U.S. pawn store market has reached a saturation point, and the expansion of new stores is increasingly constrained due to state-level regulations on short-term pawn loan interest rates. Texas and Florida, for instance, have more lenient regulations, allowing highest monthly interest rates for PLOs to reach 20-25%. However, in other states, the rates are comparatively lower. Therefore, selecting store locations becomes critical, as pawn shops require high PSC revenue to sustain cash flow operations. This creates limitations on the ability to expand further across the U.S. market.
Ezcorp currently operates 542 pawn stores in the United States, with 249 locations (46% of total stores) in Texas and 92 locations (17%) in Florida. The remaining 201 stores are distributed across 17 other states. The company maintains an average annual store growth rate of 2% in the U.S. market.

Therefore, the U.S. market for pawnshops is nearing saturation, with slow growth rates, indicating that the market is becoming mature. As a result, the expansion of new stores can no longer be considered a primary growth driver for Ezcorp. However, there remains significant potential in the pawn loan market, especially during periods of economic uncertainty, when pawn services tend to demonstrate greater resilience. There is a high demand for short-term cash requirements, making the pawn business an attractive option for consumers facing financial challenges.
The demand for pawn loans in the U.S. stems from individuals who face short-term financial needs but lack access to traditional credit sources. Common use cases include 1) Emergency expenses: Covering urgent bills such as dental care, medical costs, or utility bills; 2) Daily survival needs: Transportation costs, groceries, and rent payments; 3) Unexpected financial gaps: Job loss, car repairs, or urgent home repairs [9]. The U.S. has a substantial population living paycheck to paycheck. Surveys indicate that approximately 60% of Americans have savings below $1,000, making them highly susceptible to financial distress. As a result, pawnshops serve as a vital stopgap for individuals needing quick cash without undergoing complex credit approvals.
The U.S. credit system poses structural barriers for many borrowers. Firstly, traditional loans and credit cards require a high credit score, which many low-income individuals lack. Bank loans involve lengthy applications, background checks, and rigid qualification criteria. Payday lenders often charge exorbitant interest rates, leading to long-term debt traps. Pawn loans bypass these issues by offering immediate liquidity without requiring credit history verification. Borrowers simply pledge collateral—such as electronics, jewelry, or luxury—in exchange for cash. If they fail to repay, their credit score remains unaffected, and the pawnshop sells the item to recover costs.
About 82% of all US adults have at least one credit card, with an average of about four credit cards per US consumer, according to Experian [6]. 23% of Americans with less than $25,000 annual income have no bank account. 46% of Americans with annual incomes between $50,000 and $99,999 carried a credit card balance, while low-income Americans were more likely to predominantly use buy now, pay later, payday or pawnshop loans, with average annual interest rates of payday loans at 400%, with many much higher [6].
Since April 2021, credit card borrowing has been on the rise, with total monthly interest payments roughly doubling from $12 billion in April 2021 to $24 billion three years later [8]. This trend clearly reflects that U.S. inflation is outpacing wage growth. According to PYMNTS Intelligence, credit card debt has become widespread across different income brackets. Among high-income cardholders earning more than $100,000 annually, 75% carry an outstanding balance. This share is identical for middle-income cardholders earning between $50,000 and $100,000, while 74% of lower-income cardholders earning less than $50,000 also have balances[13].
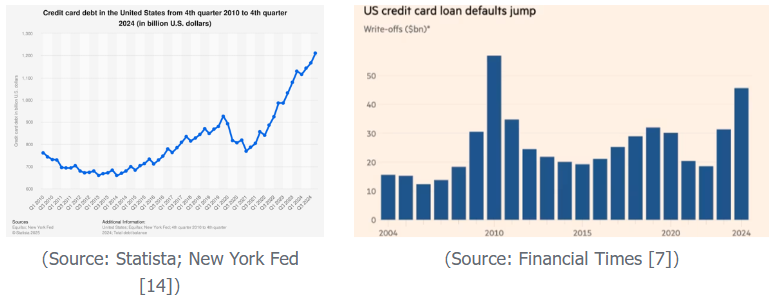
Furthermore, the interest rates on credit cards have surged to over 20%[8]. As a result, the U.S. is seeing an increase in credit card delinquencies, with outstanding credit card balances projected to reach a record high by 2025, accompanied by a sharp rise in delinquency rates. Once a cardholder defaults, it becomes challenging to secure further loans from banks, and subprime borrowers, in particular, find it even more difficult to obtain new credit cards[10][11].

(Source: Financial Times [8[)
There are growing signs that many Americans who rebuilt their savings during and after the pandemic have now depleted those funds and are increasingly relying on credit. Economic uncertainty, inflation, and high interest rates have made traditional debt burdens heavier, further driving demand for alternative lending options-pawn loans.
2) The Latin America Market
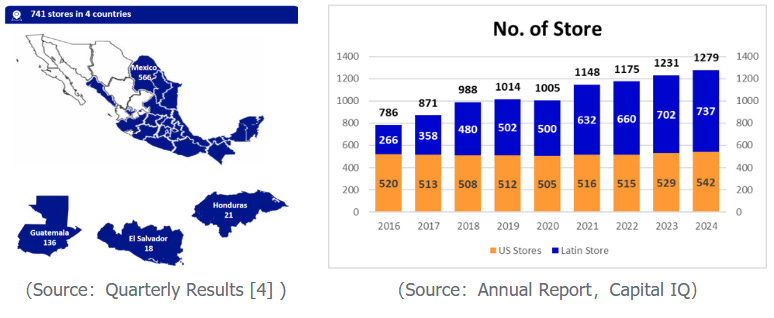
Latin American stores have been the primary driver of Ezcorp’s expansion in the future. According to the company’s Q1 FY25 quarterly results, Ezcorp operates a total of 741 stores in Latin America, with Mexico accounting for 565 stores (77%), Guatemala 172 stores (18%), and the remaining 5% distributed across Honduras (21 stores) and El Salvador (18 stores). Since acquiring over 100 stores in Latin America in 2021, the region’s store count has surpassed that of the U.S. In 2025, Ezcorp is expected to complete the acquisition of 53 additional stores in Mexico, further accelerating its Latin American expansion. The company maintains an annual store growth rate of 11% in the region, driving increases in PSC and merchandise sales revenue.
Latin America’s contribution to PSC revenue and merchandise sales revenue has been steadily increasing. In the region’s PSC revenue and secondhand goods market, it accounts for 26% and 31% of total revenue, respectively. The Latin American PSC revenue has achieved a 4-yr CAGR of 84%, while merchandise revenue in the region has grown at an average rate of 27% from 2022 to 2024. Given this strong growth trajectory, Latin America still has significant potential for further expansion.

In Latin America, pawnshops play an even more crucial role due to widespread financial exclusion. The most common use cases include 1)Daily survival needs: Many households lack savings, making pawn loans a frequent go-to for covering food, rent, and medical bills. 2)Emergency expenditures: Unexpected medical expenses and education fees drive pawn loan demand. According to World Bank's Global Findex Database, with over 50% of Latin Americans lacking access to traditional banking, pawnshops act as an indispensable financial safety net.
Latin America’s credit infrastructure is significantly underdeveloped, with major barriers including many individuals, especially in rural areas, do not have access to banking services. Even those with bank accounts struggle to obtain loans due to stringent documentation and collateral asset requirements. Traditional financial institutions charge prohibitively high rates for long-term, leaving pawnshops as the only viable alternative for short-term demand. Pawn loans offer immediate liquidity, bypassing the need for formal credit history, making them a preferred option for the financially underserved.
Latin America faces recurring economic instability. Argentina, Venezuela, and Brazil frequently experience volatile price swings, prompting individuals to seek short-term financial relief via pawn loans. Latin America’s high Gini coefficient highlights stark wealth gaps, ensuring a steady flow of low-income borrowers to pawnshops. The resale of electronics, jewelry, and luxury goods is booming, creating additional revenue streams for pawnshops. Pawn loans in Latin America experience relatively higher default rates since pledged assets often consist of low-value, high-turnover items. However, this also means that 1) Liquid secondary market: Items such as mobile phones, watches, and small appliances are in constant demand, ensuring quick resales; 2) Pawnshops mitigate risks: The ability to rapidly turn over inventory allows businesses to manage default-related losses efficiently.
The type of collateral in Latin America determines that PLO principal amounts are generally lower than in the U.S., resulting in lower PSC revenue per transaction. However, despite its growing significance, the pawn industry in Latin America remains underpenetrated. Given the region's low financial inclusion rates, pawnshops still have substantial opportunities for both geographic and customer base expansion. With these factors in play, Latin America represents the strongest growth driver for Ezcorp, offering significant upside potential for long-term expansion.
4 Valuation


EZCorp (EZPW) is currently trading at an EV/EBITDA multiple of 4.7x and a P/E multiple of 12.9x. While its P/E ratio is relatively close to the industry median, its EV/EBITDA multiple is significantly lower, trading at a nearly 2 times discount compared to the median EV/EBITDA of 8.2x. Given this discrepancy, I have based my valuation on the 2025 median multiples of 11.7x EV/EBITDA and 11.3x P/E to better reflect the company's fair market value.
Using these median valuation benchmarks, I derived a target price of $22.64 per share through a weighted approach, with equal emphasis on EV/EBITDA and P/E-based valuations. This represents a 55% upside from the last trading price of $14.65. The significant undervaluation based on the EV/EBITDA metric suggests that the market may not be fully recognizing EZCorp’s earnings potential, creating an opportunity for substantial re-rating as valuation multiples normalize closer to industry medians.
5 Risk
5.1 Seasonality and the Impact of Tax Refunds
EZCorp’s PLO are subject to seasonal fluctuations. The 25Q1(2024/10-2024/12) typically benefits from higher consumer spending driven by holiday-related demand, leading to increased pawn loan activity. However, 25Q2 (2025/1-2025/3) faces headwinds due to the tax refund season, during which many customers use refunds to repay outstanding loans rather than take on new ones. This results in a decline in PLO quarterly-on-quarterly in 25Q2. While this is a temporary and expected seasonal effect, it can create short-term volatility in revenue. That said, PLO is still expected to show year-over-year growth, reflecting the company's overall business expansion and resilience.
5.2 Risk of Pawn Loan Rate Variability, Particularly in Texas and Florida
EZCorp's business is highly concentrated in Texas and Florida, where over 60% of its pawn stores are located, with Texas alone accounting for approximately 46%. Any regulatory changes affecting pawn loan rates in these states could have a significant impact on the company’s profitability. If pawn loan rates are adjusted downward, it would directly reduce pawn service charges (PSC) revenue, which is one of key income sources for the company. Given the heavy reliance on these two states, any unfavorable regulatory changes would disproportionately affect EZCorp compared to more geographically diversified competitors
5.3 Gold Price Volatility
A portion of EZCorp’s revenue comes from the resale of pawned gold and jewelry. Gold prices can be volatile, influenced by macroeconomic factors such as inflation, interest rates, and geopolitical risks. A decline in gold prices could reduce the resale value of pawned items, leading to lower gross margins on merchandise sales. Conversely, while higher gold prices could boost resale values, they may also deter customers from pawning gold items due to higher upfront costs, potentially reducing loan originations. This dual impact makes gold price fluctuations a key external risk to EZCorp’s earnings stability.
6 Reference:
【1】https://occc.texas.gov/sites/default/files/uploads/interest/p-rate-16.pdf
【2】https://occc.texas.gov/sites/default/files/2024-07/Revised%20Brackets.pdf
【3】https://www.ezcorp.com/static-files/6b5ea442-21bc-462d-96e1-be1ad76bf294
【4】https://www.ezcorp.com/static-files/ba30a41a-34ca-4c39-8f9a-79ad9100c6e2
【5】Statista. (May 30, 2024). Share of second hand purchasers in selected countries as of March 2024 [Graph]. In Statista. Retrieved March 31, 2025, from
https://www.statista.com/
【6】https://www.theguardian.com/business/2025/feb/11/us-credit-card-debt
【7】https://www.ft.com/content/c755a34d-eb97-40d1-b780-ae2e2f0e7ad9
【8】https://www.ft.com/content/b60117dd-fe72-47cb-abaf-9020be424413
【10】 https://www.independent.co.uk/news/business/credit-card-default-debt-b2676811.html
【12】https://www.nationalpawnbrokers.org/pawn-industry-faqs/
【14】New York Fed. (February 14, 2025). Credit card debt in the United States from 4th quarter 2010 to 4th quarter 2024 (in billion U.S. dollars) [Graph]. In Statista. Retrieved March 31, 2025, from https://www.statista.com/statistics/245405/total-credit-card-debt-in-the-united-states/
7 Appendix
