


Initial Report: Futu Holdings Ltd (NASDAQ: FUTU), 85% 5-yr Potential Upside (VIP GC, Billy ZHANG)
Billy analyses that Futu Holding's net profit is greatly affected by the market environment. When the market has a cyclical nature, Futu's net profit also has a cyclical nature.


Company Overview
Futu Holdings Limited is an internet brokerage company providing investors with US and Hong Kong stock trading services, with a one-stop financial trading platform, Futu Niu Niu, which supports A-shares, Hong Kong stocks, and US stocks, covering PC, MAC, iOS, and Android.It primarily serves the newly affluent Chinese population seeking a plethora of opportunities to facilitate the once-in-a-lifetime transformation of the wealth management industry and to build a broader digital portal for a wider range of financial services.
In Part 1, this article will explore two questions
(1) What does Futu's revenue consist of?
(2) How and why total and segmented revenues have changed in recent years.
Five stages of Futu growth
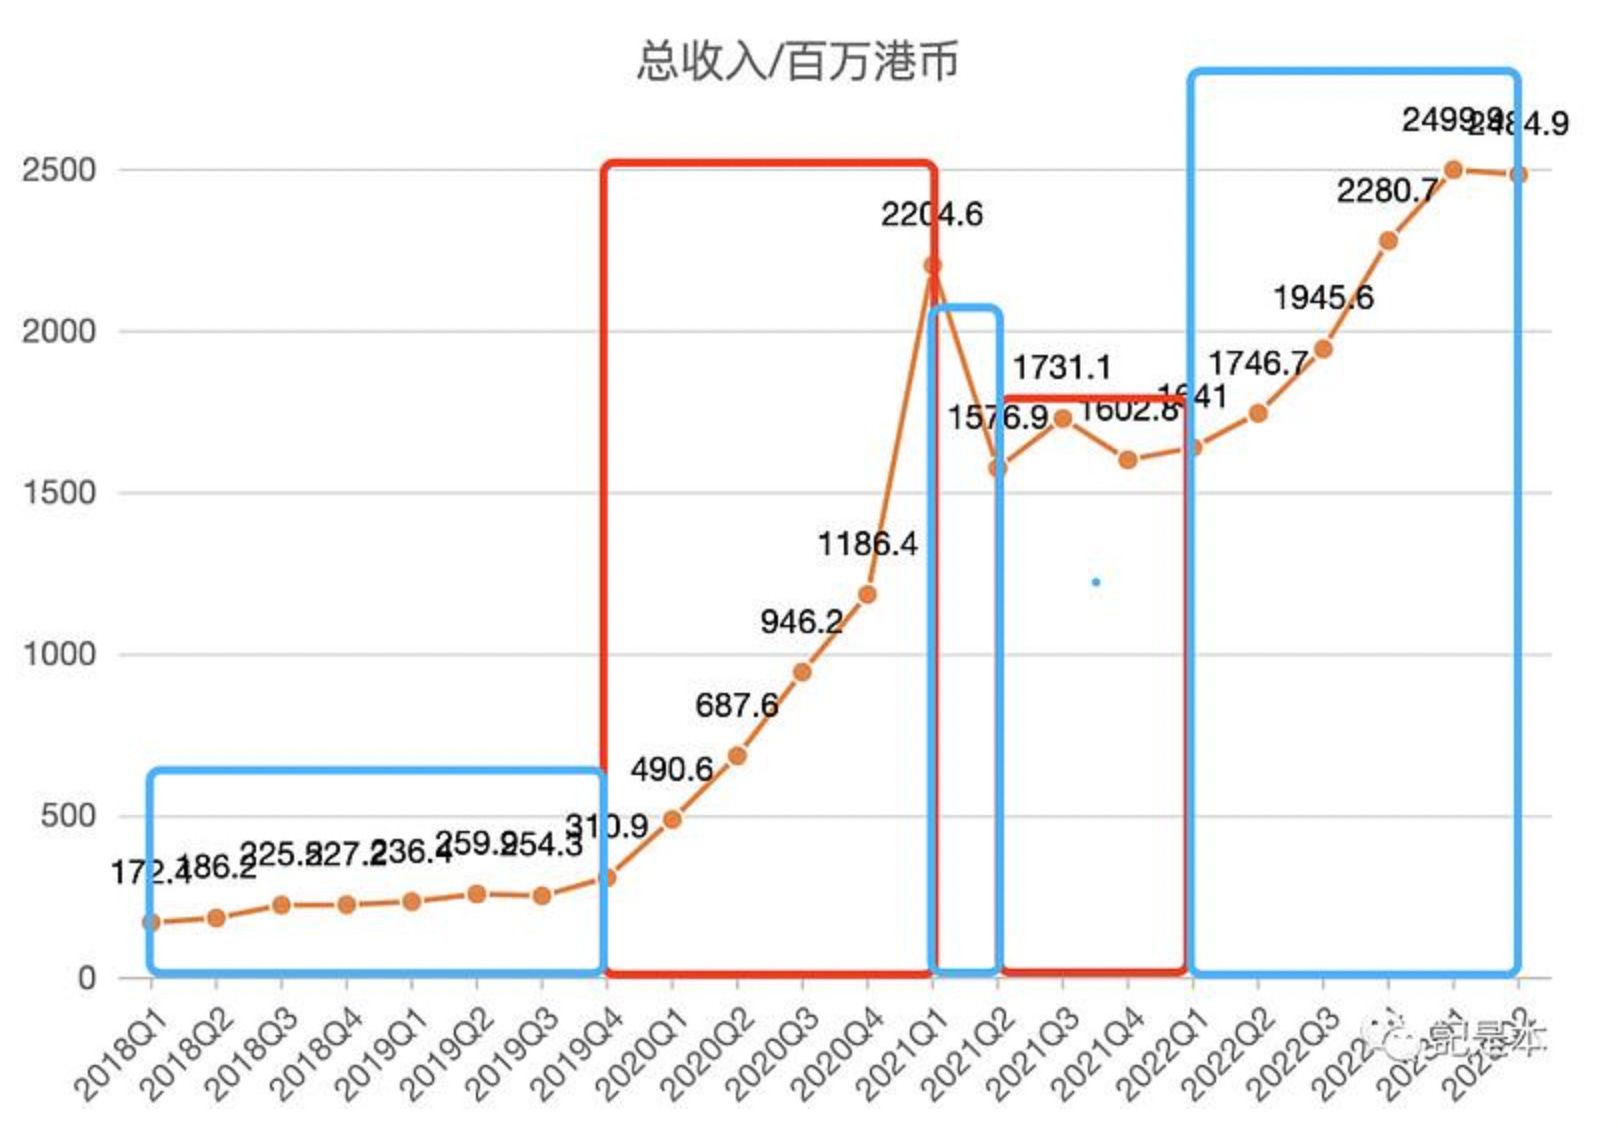
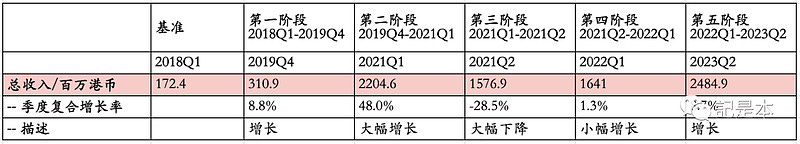
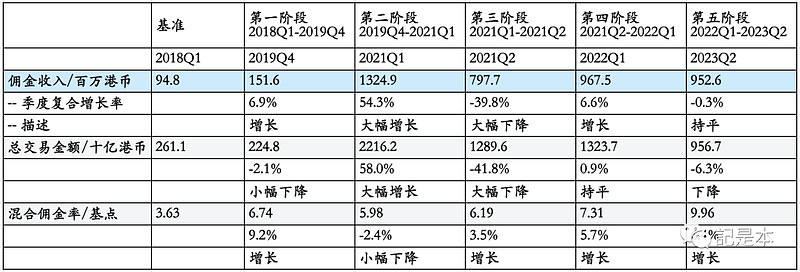
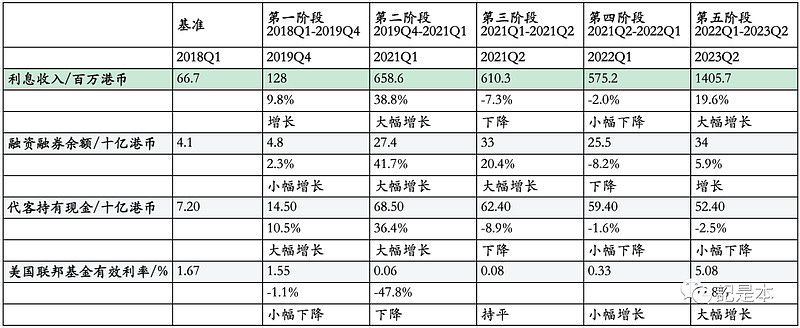
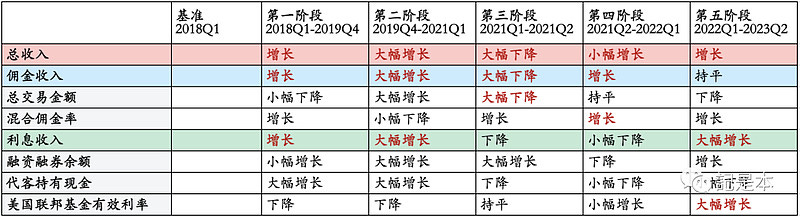
With reference to the table above, the five phases are:
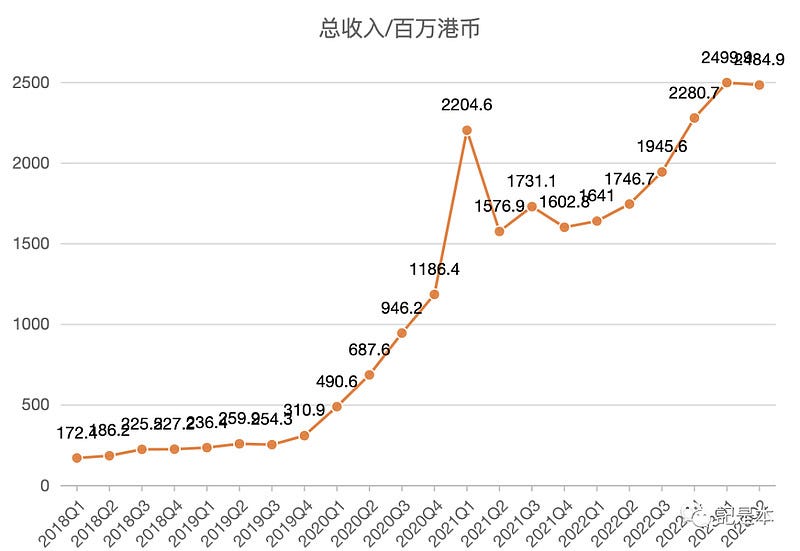
1) Phase 1 2018Q1-2019Q4: total revenue grew from HK$172.4 million to HK$310.9 million, which is a period of 7 quarters, and can be calculated to have a quarterly CAGR of 8.8%
(2) Stage 2 2019Q4-2021Q1: Total revenue increased significantly from HK$310.9 million to HK$2204.6 million, representing a CAGR of 48%.
3) Stage 3 2021Q1-2021Q2: this stage only has 1 quarter, total revenue dropped significantly from HK$2204.6 million to HK$1576.9 million
4) Stage 4 2021Q2-2022Q1: total revenue shows a slight growth trend, which can also be said to be up and down
5) Stage 5 2022Q1-2023Q2: Total revenue grew at a CAGR of 8.7%.
Here we only describe how the total revenue changes in the five stages, without analyzing the specific reasons. This is because before analyzing the causes, one needs to analyze the components and influencing factors of total revenue.
So, let's take a look at the composition of total revenue.
Revenue composition
Futu's revenue has three main components: brokerage commission and fee income, interest income and other income, as shown in the table below.
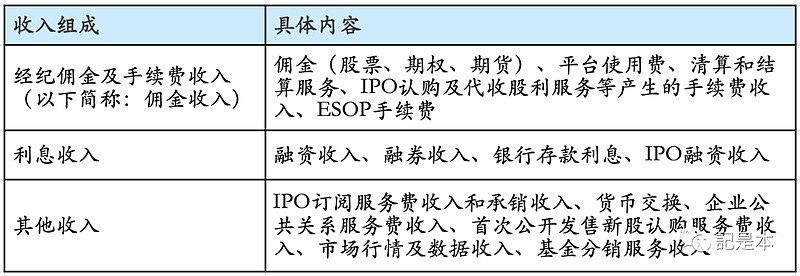
The commission income is mainly including the commission of various transactions, platform usage fee and so on. The common ones are the commissions and platform usage fees charged by Futu when we usually trade with Futu.
Interest income includes the interest charged when providing financing and securities financing to users, the interest on bank deposits, and the interest charged when providing new IPO financing. The source of funds for providing financing to customers is partly own funds; the other part is borrowings from other financial institutions, and Futu earns the difference in interest.
Other revenues are mainly from providing other services to individuals or enterprises.
Overall, the composition of revenue is relatively well understood.
Next, let's look at the percentage of each component of revenue.
Combined with the data on the ratio of the three parts of revenue to total revenue for each quarter since 2018Q1 in the chart below, it can be seen that the revenue is mainly contributed by commission income and interest income, and other revenue has a low percentage, which is less than 10% overall.

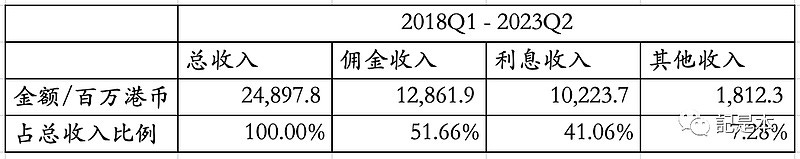
Since other revenues account for a very small percentage and commission income and interest income together account for 90%+, we will focus on analyzing commission income and interest income next.
Commission revenue
According to the information provided in Futu's earnings report, commission revenue can be expressed by this formula:
Commission Revenue = Transaction Amount * Blended Commission Rate.
The transaction amount is the amount of money that the user has traded on Futu.
The blended commission rate is the percentage of the transaction amount that Futu charges in commissions, platform usage fees, and other fees.
For example, if a user buys a stock for HK$10,000 (the transaction amount), and Futu charges a commission and platform usage fee of HK$10, then the commission rate is 10/10,000, or 10 basis points (1 basis point = 1/10,000).
Next, let's look at the change in the transaction amount and the blended commission rate.
Transaction Amount
The chart below shows Futu's commission revenue and transaction amount by quarter. It can be seen that the growth and decline of commission revenue is very close to the trend of transaction amount, when transaction amount increases, commission revenue also increases and vice versa
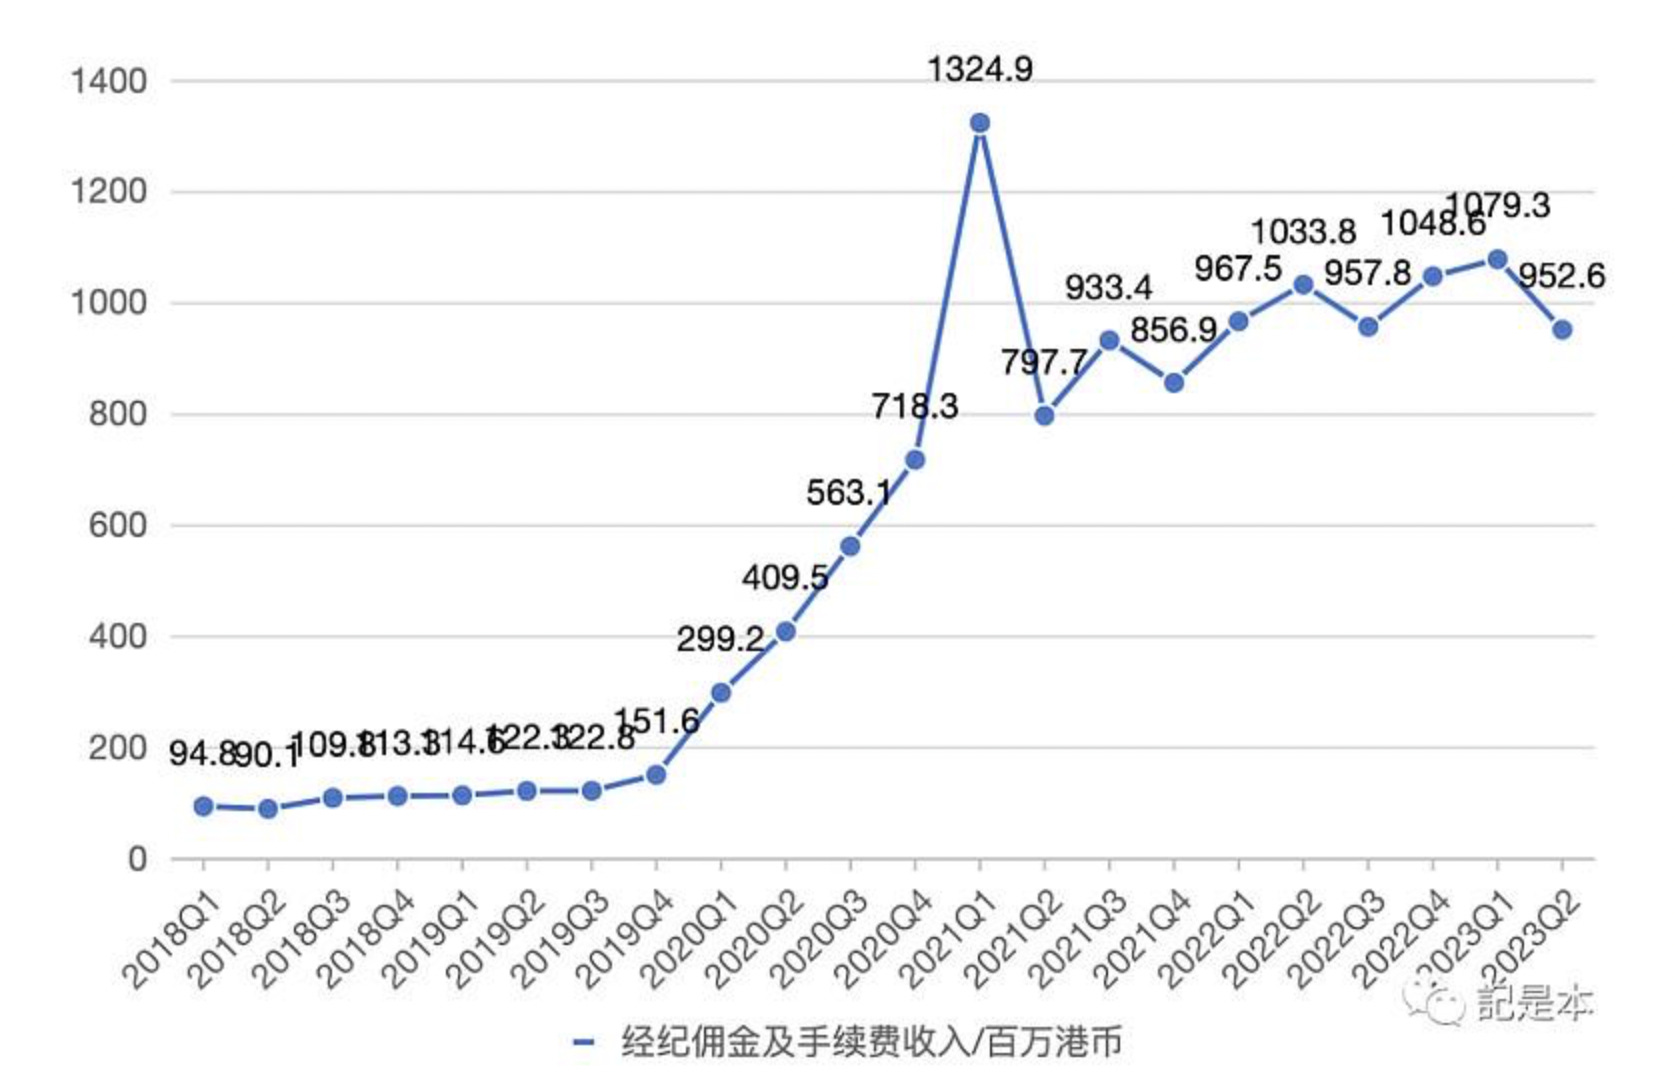
.
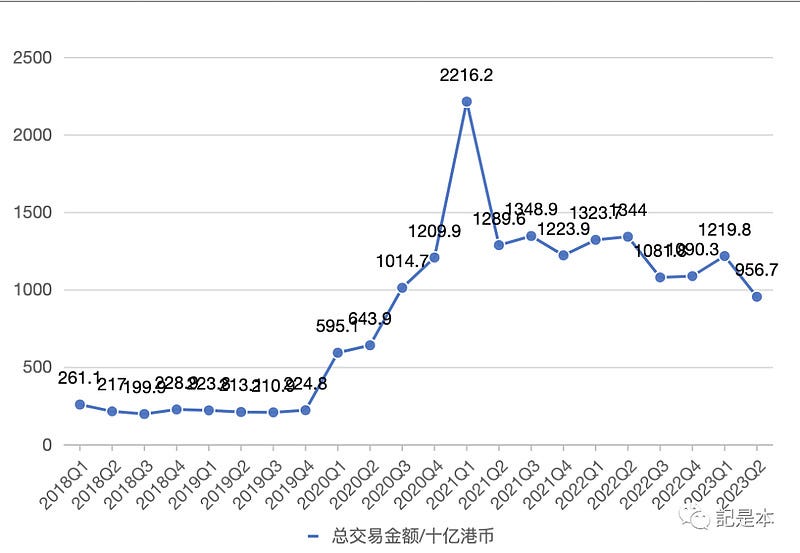
This is really determined by the formula for commission revenue, which trends exactly in line with the transaction amount, assuming the blended commission rate remains constant.
For the transaction amount, it can also be broken down into two parts: U.S. stock transaction amount, Hong Kong stock transaction amount plus HFT transaction amount. The correlation between Futu's transaction amount and the overall market trading activity is very high.
Looking at the chart below, Futu's U.S. stock trading amount is very much in sync with the trend of Nasdaq volume, and so is the trend of Hong Kong stock + Shanghai-Hong Kong Stock Connect trading amount with the trend of Hang Seng Index turnover.
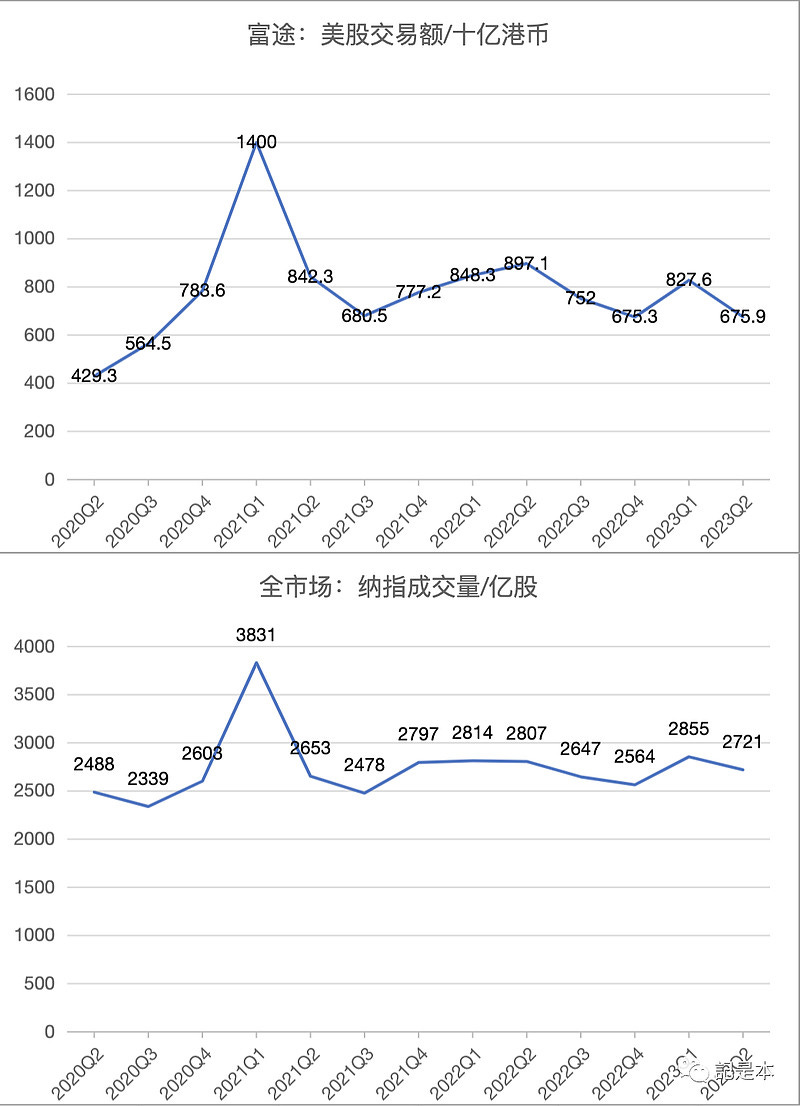
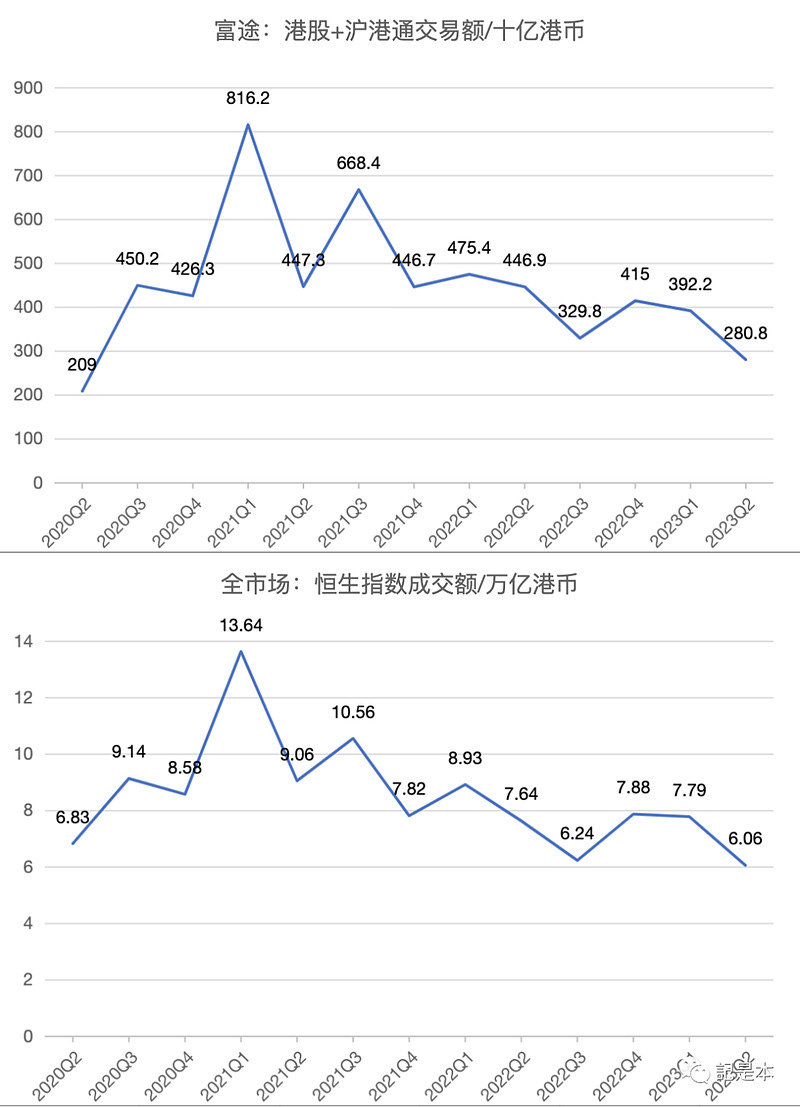
That is to say, when the market is active, Futu's trading volume will also be high, and the commission income will increase significantly; while when the market is cool, Futu's trading volume will also drop, and the commission income will follow.
Mixed Commission Rates
Although Futu's transaction amount is affected by market activity and is less predictable, the overall trend of Futu's blended commission rate is increasing (see the chart below).
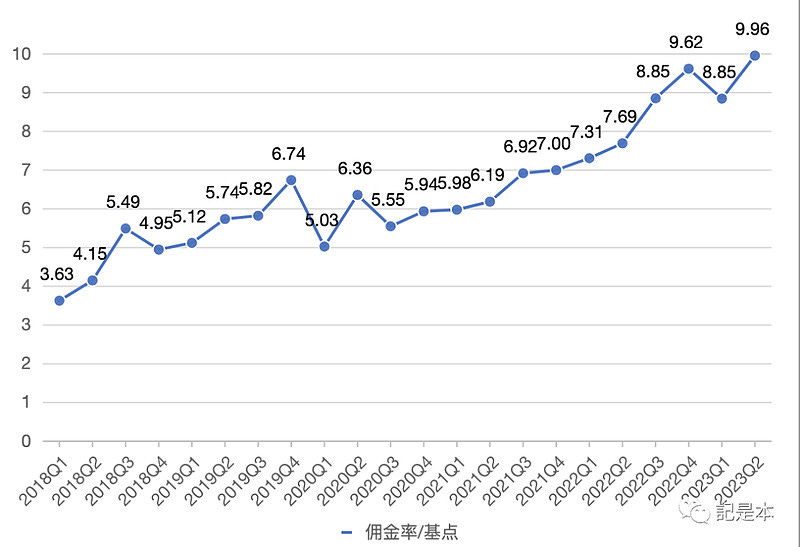
The reason for the rise could be due to the fact that the commission offers to users are decreasing. For example, as the number of points users use to redeem commission coupons decreases, the amount of commission users have to spend becomes more.
Of course, it is still unknown whether commission rates will continue to rise in the future and, if they do, how much room there is for them to rise.
Changes and Reasons
Based on the above changes in transaction amount and blended commission rate, we can get the reasons for the changes in commission income in each stage (combined with the table below):
(1) Stage 1: commission revenue grew from HK$94.8 million to HK$151.6 million, a CAGR of 6.9%; the growth was mainly driven by an increase in the blended commission rate and a small decline in the total transaction amount
(2) Stage 2: Commission revenue grew significantly, driven by a hot market that brought about a significant increase in transaction value and a slight decline in the blended commission rate.
(3) Phase 3: commission income fell sharply, driven by a rapid cooling of the market and a significant decline in transaction value for Futu, with an increase in the blended commission rate
(4) Stage 4: Commission income increased, mainly due to an increase in the blended commission rate, and the transaction amount remained flat
(5) Stage 5: Commission revenue was flat, blended commissions were still growing but were offset by a decline in deal value
Interest revenue
The following table shows the composition of interest income for the past five years. It can be seen that, except for the bridge loan, all the others are interest income generated from financing and bank deposits, while the interest income from the bridge loan does not account for a high percentage.
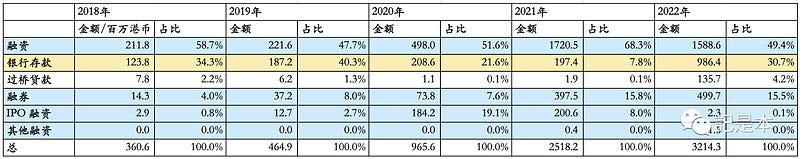
Therefore, in the following, we mainly analyze the financing financing and bank deposits.
Similar to commission income, for interest income, suppose we can also express it with a formula:
Interest Income ≈ (Finance Facility Scale + Bank Deposit) * Blended Interest Rate.
The reason why it is an assumption here is because Futu's financial report does not use such logic, and here are the assumptions made in this article in order to analyze the interest income. Just to illustrate, interest income is related to financing and financing scale, bank deposits and blended interest.
Look back at the formula. The size of the financing facility can be obtained from the financing facility balance in the financial report. Although the financing facility balance only represents the user's financing facility size at the end of the period, it cannot accurately represent the user's financing facility size during the period. However, we can still see the approximate size of financing and financing from the ending balance of financing and financing.
A large part of the interest income from bank deposits comes from Futu's cash held on behalf of customers, and this data can be obtained from the balance sheet.
Although we don't know exactly what the blended interest rate is from the financial report, the blended interest rate is certainly proportional to the market interest rate. So, we can analyze it with the help of the trend of market interest rates.
Below we will analyze the changes and reasons for Futu's interest income with the help of financing balance, bank deposits (cash held on behalf of customers) and market interest rates.
Changes and Reasons
The following chart shows Futu's interest income, financing and financing balances, cash held on behalf of customers, and the U.S. Federal Funds Rate (which represents the market interest rate) for each quarter.
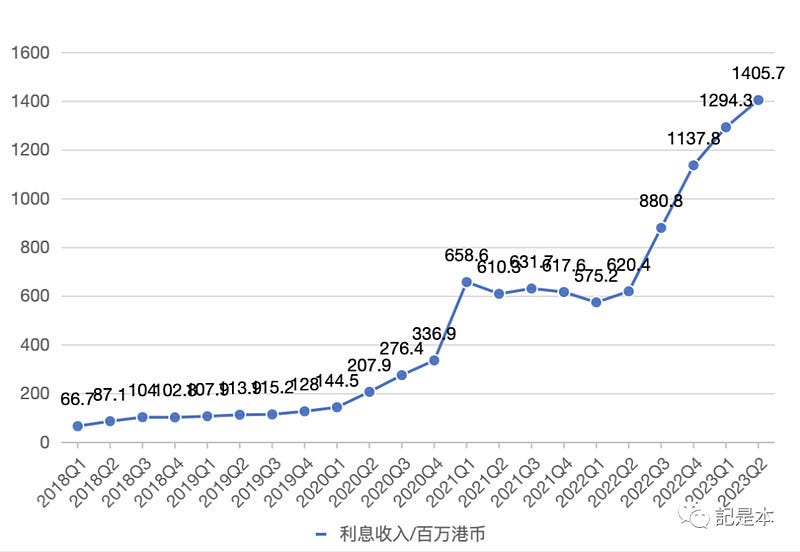
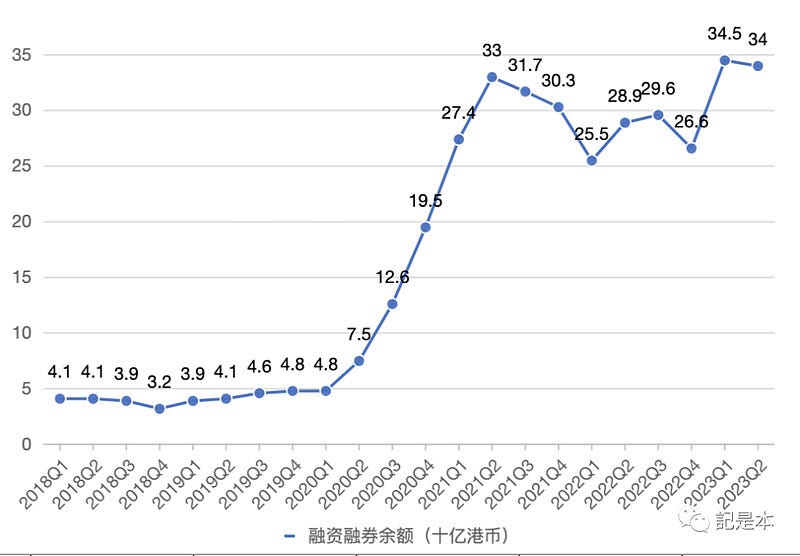
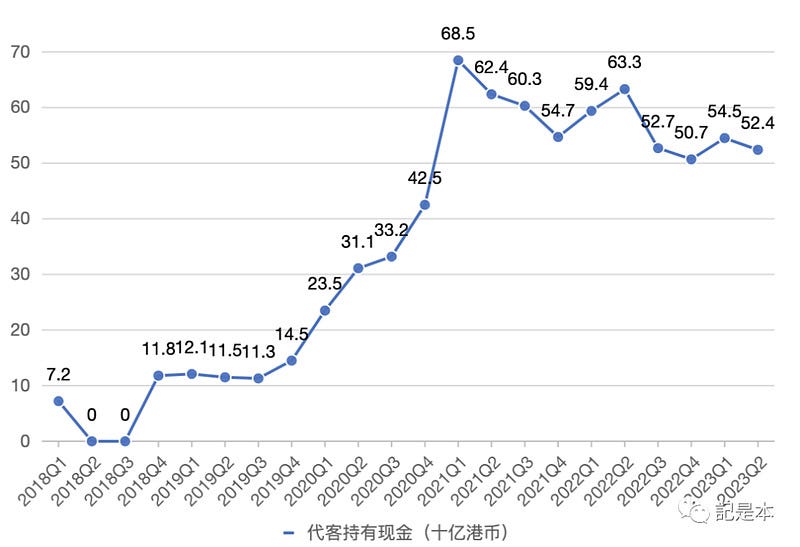
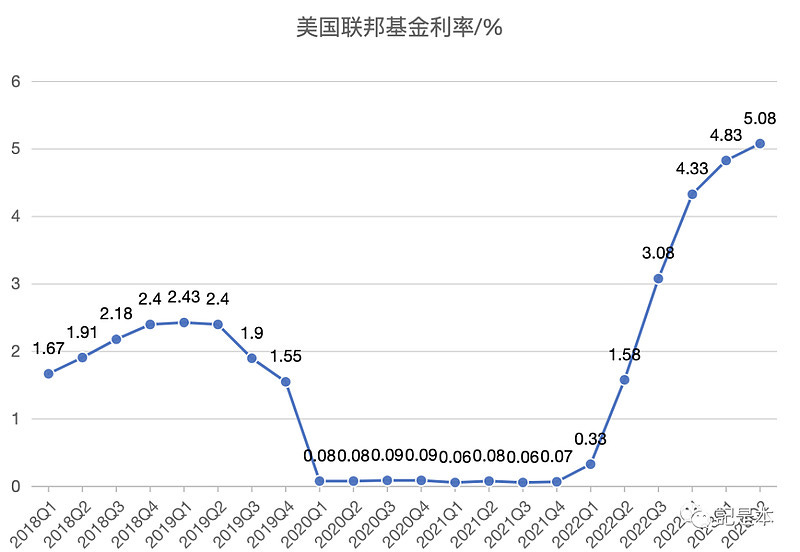
Combined with the above chart and the table below, it can be seen that interest income has changed in five stages and the reasons for this are:
(1) Stage 1: Interest income was growing, from HK$66.7 million to HK$128 million, with a CAGR of 9.8%. The growth in this stage was mainly due to a small increase in the balance of the financing facilities and a significant increase in cash held on behalf of customers, with a small decrease in interest rates.
(2) Stage 2: Significant growth in interest income, driven by a sharp increase in the balance of financing facilities and cash held on behalf of clients, which was also influenced by active market trading, while interest rates were declining.
(3) Stage 3: Interest income is declining, with financing facilities still growing, which should be attributed to the inertia of the bull market, while cash held on behalf of customers is declining, and interest rates are basically flat
(4) Stage 4: Interest income is declining slightly, both financing and cash held on behalf of clients are declining, and interest rates are little changed.
(5) Stage 5: Interest income increased significantly, mainly due to the rapid increase in interest rates as a result of the Fed's interest rate hike, financing facilities increased, and cash held on behalf of clients was declining.
Revenue summary
In summary, as shown in the chart below, Futu's total revenue consists of three components: commission income, interest income and other income, of which other income accounts for a small percentage.
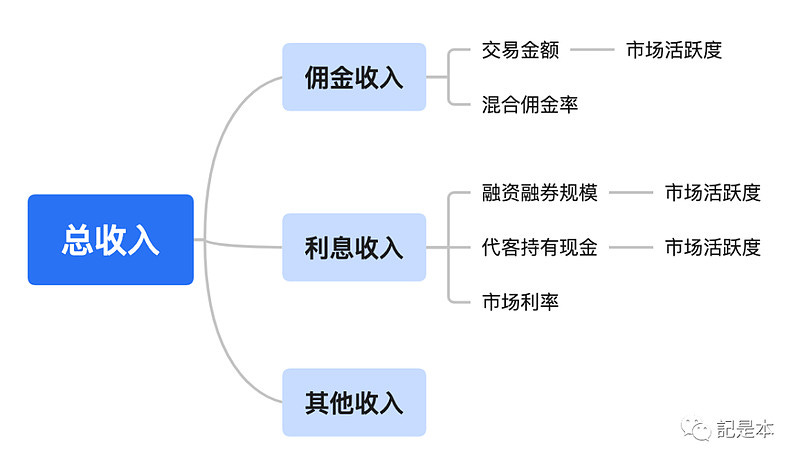
Commission income is in turn determined by the amount of trades made by users and the blended commission rate charged by Futu, where the amount of trades made is in turn affected by the level of market activity.
Interest income, on the other hand, is affected by the scale of financing and financing, cash held on behalf of customers and market interest rates, where the scale of financing and financing and cash held on behalf of customers are also related to market activity.
Therefore, after the above analysis, we can summarize the reasons for the change of Futu's revenue from 2018Q1-2023Q2 as follows (combined with the table below):
1) Phase 1 2018Q1-2019Q4: the growth of total revenue comes from the joint growth of commission revenue and interest revenue; the growth of commission revenue comes from the growth of blended commission rate; the growth of interest revenue comes from the growth of financing financing and cash held on behalf of customers
2) Phase 2 2019Q4-2021Q1: Significant growth in total revenue comes from significant joint growth in commission income and interest income; significant growth in commission income comes from significant growth in total transaction value; significant growth in interest income comes from significant growth in financing facilities and cash held on behalf of clients
3) Phase 3 2021Q1-2021Q2: a significant decline in total revenue comes from a significant decline in commission revenue; a significant decline in commissions comes from a significant decline in total transaction value
4) Phase 4 2021Q2-2022Q1: small increase in total revenue comes from small increase in commissions; small increase in commissions comes from increase in blended commission rate
5) Phase V 2022Q1-2023Q2: growth in total revenue comes from a large increase in interest income; the large increase in interest income comes from a large increase in market interest rates
Based on the above analysis of the factors influencing Futu's total revenues, a brief outlook of Futu's future total revenues can be made as shown in the table below.
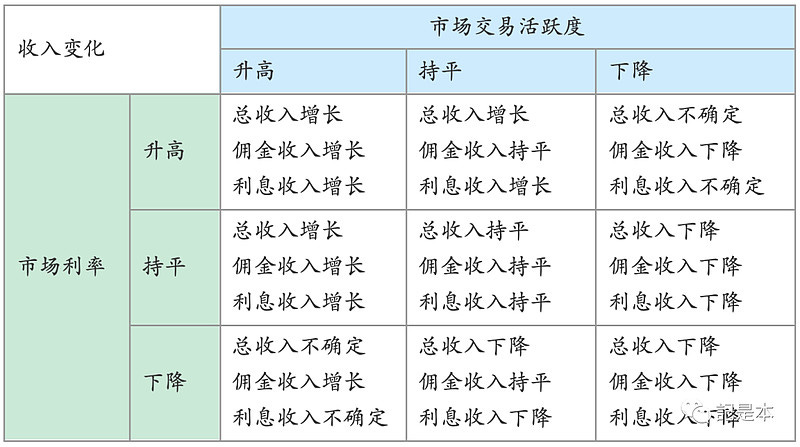
Here we immediately get thesis 1 by intuition.
Operating expenses
Operating expenses consist of three main components: research and development expenses, sales and marketing expenses, and general and administrative expenses.
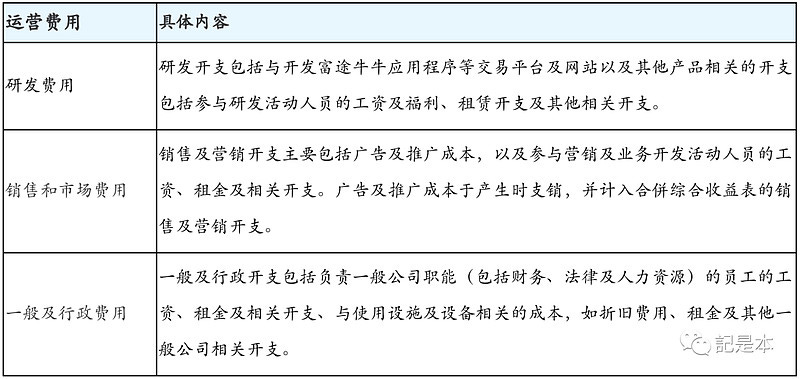
The description of each expense in the table is already relatively clear. Simply put, R&D expenses are the expenses related to the development of individual trading software; sales and marketing expenses are the expenses related to advertising and promotion, mainly for customer acquisition; and general and administrative expenses are the expenses related to functional departments (finance, legal, HR, etc.).
The chart below shows the change in operating expenses with each expense since 2018Q1.
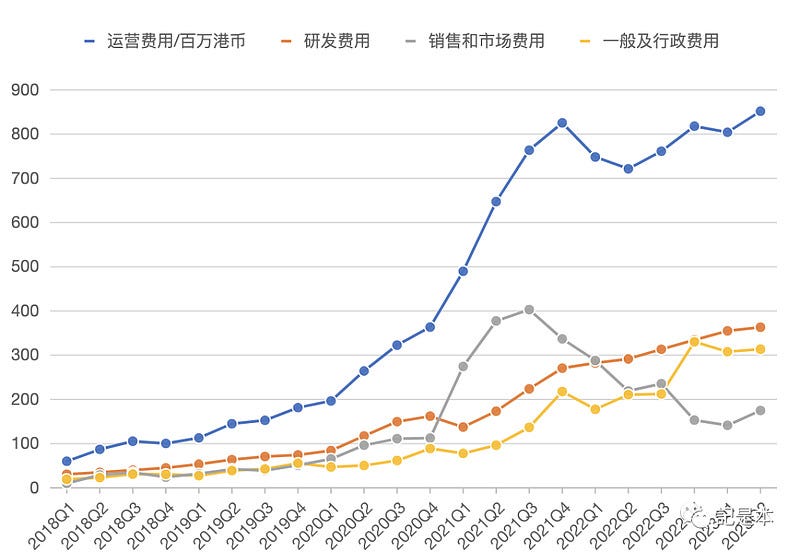
As you can see, operating expenses are rising all the way from 2018Q1 to 2021Q4, which actually follows the rise in revenues.
However, expenses reached a high point in 2021Q4 as opposed to 2021Q1 when revenues reached a high point. The reason for this is that fees are relatively more rigid and take time to adjust, whereas revenues are falling rapidly as the market cools. So there is a time lag.
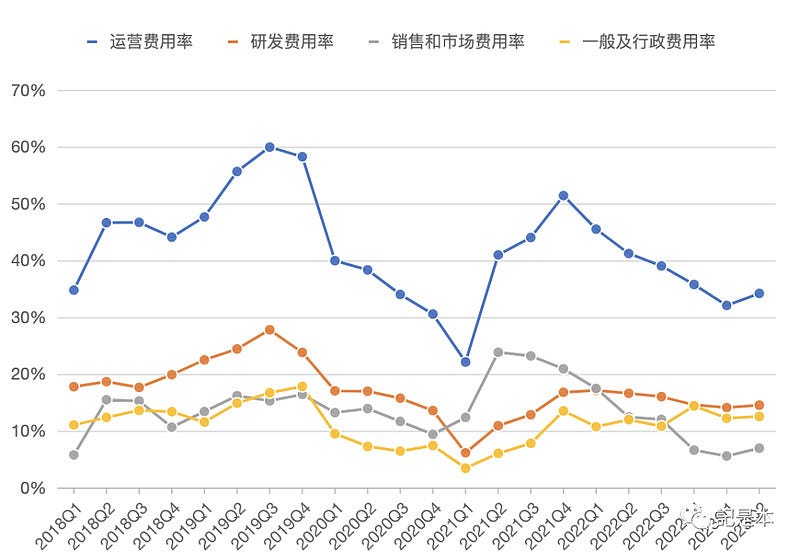
So far in 2021Q4, total operating expenses have fallen and then risen, with not much incremental growth. Against the change in total revenues, total revenues have been rising from 2021Q4 to date, which has led to a decline in the total operating expense ratio.
The decline in total expense ratio is mainly due to Futu's reduction in advertising expenses for customer acquisition. 2021Q4 year-to-date sales and marketing expenses have declined very much, from HK$400 million in a single quarter in 2021Q3 to HK$175 million in a single quarter in 2023Q2. Expenses are declining and so is the expense ratio naturally. The advertising expense ratio has been the single lowest expense in the last three quarters.
And R&D and general and administrative expenses are still growing at some rate with little change in the expense ratio.
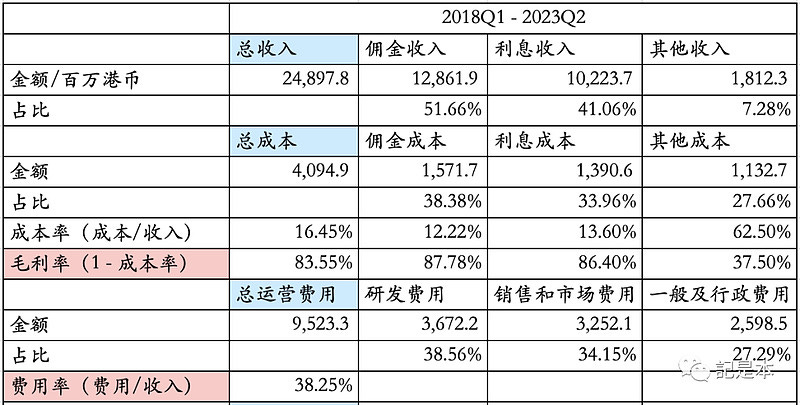
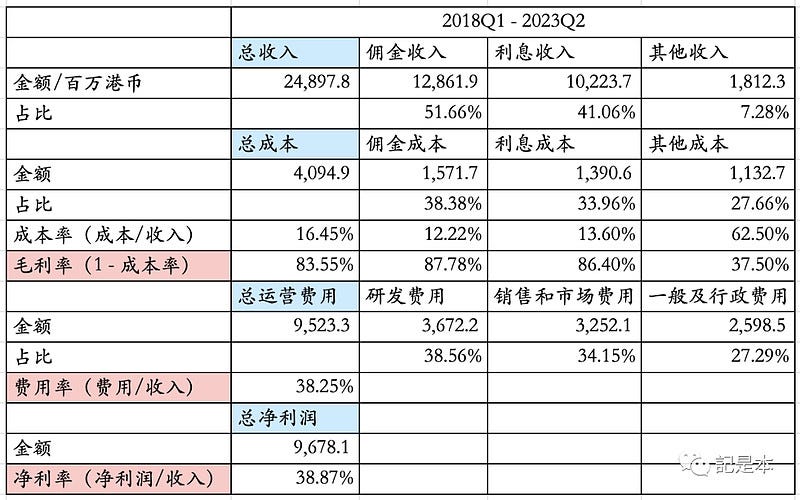
Still summarizing the data from 2018Q1-2023Q2, the expense ratio is 38.25%. Expenses are 2.3 times more than costs.
Looking at costs and expenses, we next look at net profit.
Cost of sales
Corresponding to the revenues, Futu's costs also consist of three components:
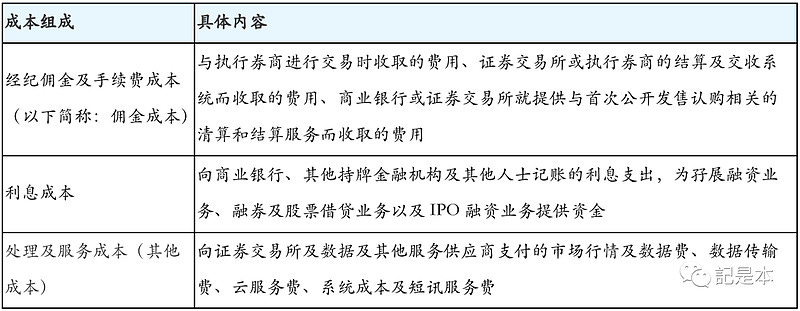
Costs are not difficult to understand. Commission costs are the clearing and settlement fees that Futu has to pay to stock exchanges when users trade with Futu, the clearing and settlement fees that Futu has to pay to third-party brokerage firms when they use their services, and the clearing and settlement fees related to IPO subscriptions.
Interest costs are the interest paid by Futu when borrowing from other banks and financial institutions. For example, borrowing is required to carry out financing and securities financing business when own funds are insufficient.
Processing and service costs (other costs) are the expenses incurred by Futu when acquiring market quotation data, data transmission, cloud and other services.
The table below gives the total of each cost for the period 2018Q1-2023Q2. For better comparison with revenue, the various revenues for the same period are also given.
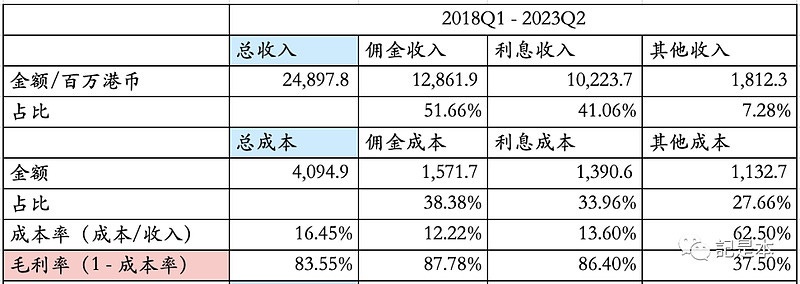
It can be seen that commission income and interest income accounted for 92.72% of the total revenue during 2018Q1-2023Q2, but commission cost and interest cost only accounted for 72.34% of the total cost during the same period.
This indicates that the cost ratio corresponding to commission income and interest income is relatively low. Correspondingly, their gross margins are high, reaching 87.78% and 86.40% respectively.
Coupled with the fact that commission income and interest income are the main sources of revenue, their high gross margins also drove the overall gross margin to 83.55%.
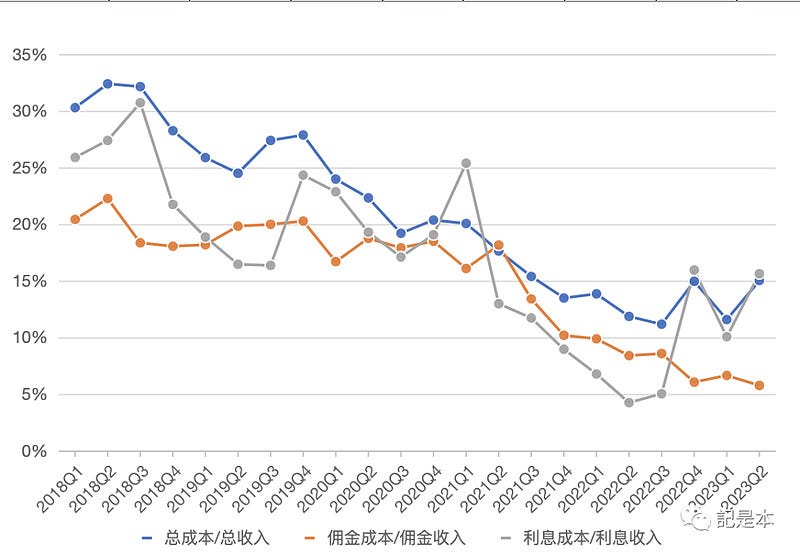
Quarter-on-quarter, the cost ratio as a whole is on a downward trend. On the one hand, the quality of revenue is rising, and more revenue can be generated by paying the same cost, for example, the increase in blended commission rate brought about by the increase in revenue, which does not require additional costs. On the other hand, cost control, such as self-developed clearing system can reduce the cost of using third-party brokerage services.
Looking at the overall gross margin of 83.55%, Futu's cost control is excellent. Next we look at operating expenses.
Net profit
As you can see from the table below, the net margin for the period 2018Q1-2023Q2 amounted to 38.87%, which should be considered very high.
Thesis 1: Kweb and U.S. Stock, the two major markets of Futu, are expected to improve in 2024.
Nasdaq is undergoing a bull market in 2023 with the index reaching a record high, which might indicate a good commission revenue for the annual report. Besides, the FED shows preference for lowering the interest rate in the December month meeting, which could further stimulate the stock market in 2024.
Though Kweb behaved badly this year, and the transaction amount on Futu has also fallen dramatically, it has also reached an undervalued situation, and a turning point might come at any time. The transaction amount is so low that there's nothing to lose.
Thesis 2: Futu shows excellent control of cost, expense and profit even in a bear market. And the margin can further be improved in this trend.
And as you can also see from the two graphs below, the trend in net margin is very similar to the trend in revenue. Since 2020Q1, the net margin has never been below 30%.
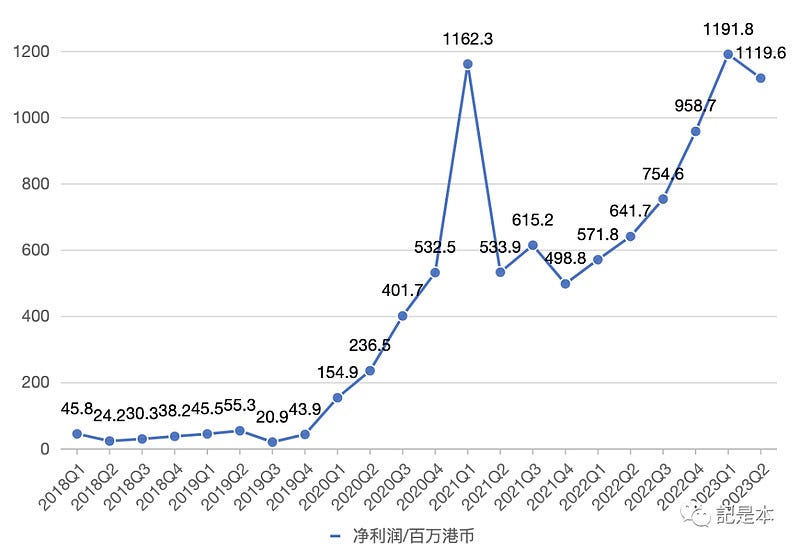
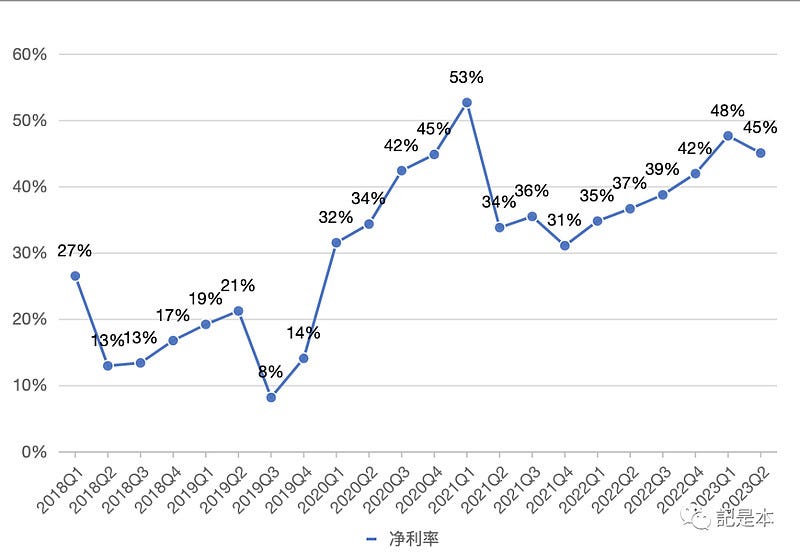
Overall, Futu is good enough in terms of costs, expenses and profits. At the same time, it can also be seen that net profit is greatly affected by the market environment, the market has a cyclical nature, then Futu's net profit also has a cyclical nature.
Competitive advantages
Thesis 3: High quality users compared to peers forming a network effect.
User size
There are three types of Futu users:
1) Users: those who have an account on Futu's trading software
2) Registered users/clients: users who have made securities account opening
3) Users/clients with assets: registered users who have assets/funds on their securities accounts
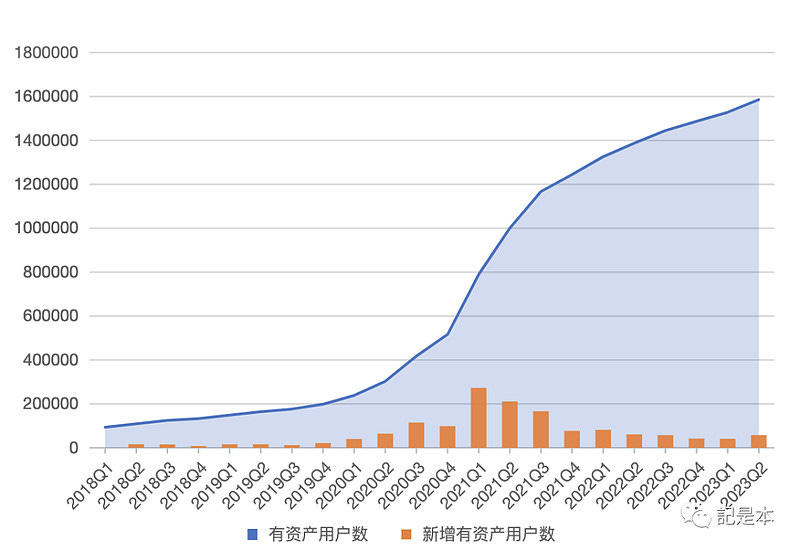
As you can see, these three types of users are in a progressive relationship. Below is a graph showing the trend of the three types of users. It can be seen that the number of users, registered users and users with assets is growing.
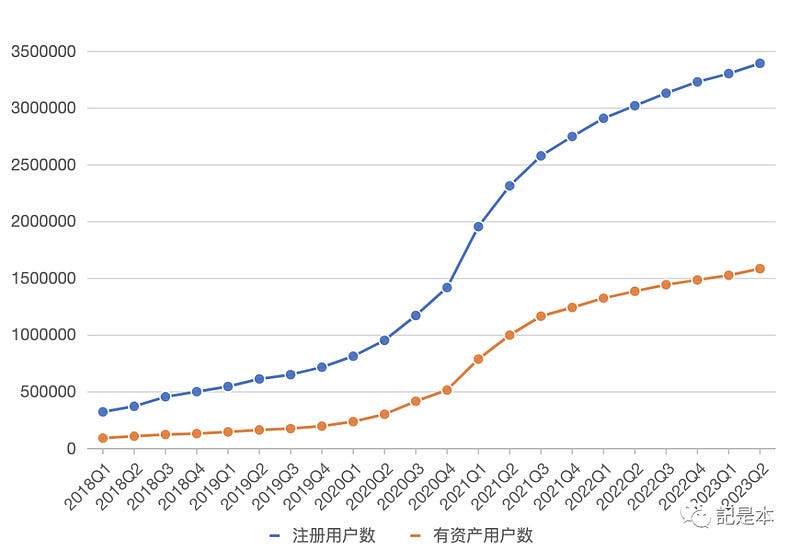
The chart below shows the change in chain growth rate. It can be seen that the fastest growth rate (YoY) quarter is 2021Q1, which is also because of the bull market. And along with the cooling of market trading in these two years, the growth rate has been going down in recent years. Of course, another important reason for the decline in growth rate is that Futu's customer acquisition in mainland China has been restricted.
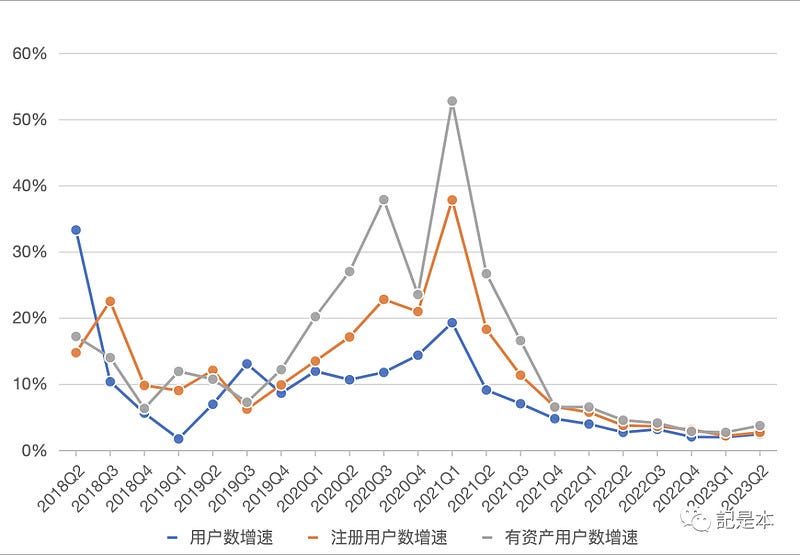
In terms of the change in the number of users with assets, the fastest increase in the number of users with assets was in 2021Q1, with an increase of 270,000 users in a single quarter, with a growth rate of more than 50% YoY.2021Q4, the number of users with assets increased by less than 100,000 users in a single quarter, which showed a slow growth.
User asset
The following chart shows the trend of total assets and per capita assets of users. It can be seen that after reaching a peak of HK$503.2 billion in 2021Q2, the total assets of users have not reached a new high since then.
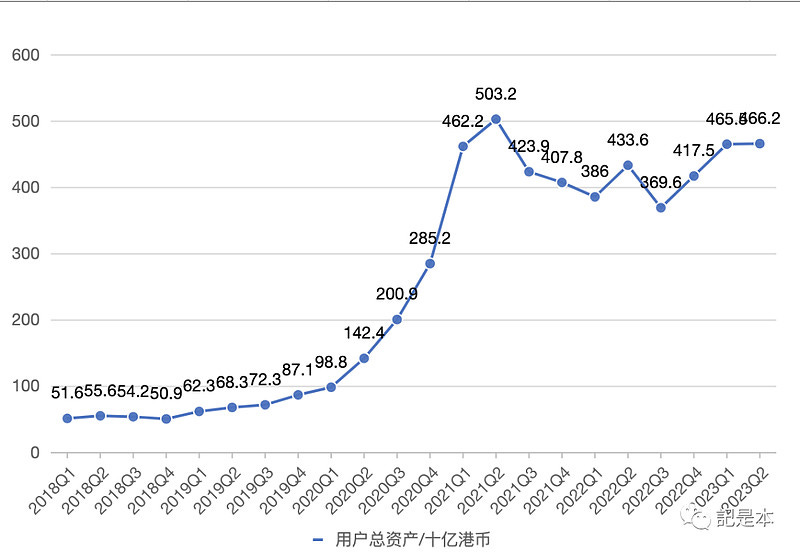
One reason is that a lot of Futu users, especially mainland users, have a relatively large proportion of China stocks in their positions, however, China stocks have fallen sharply since 2021Q2 and are still in a state of backwardation compared to their highs.
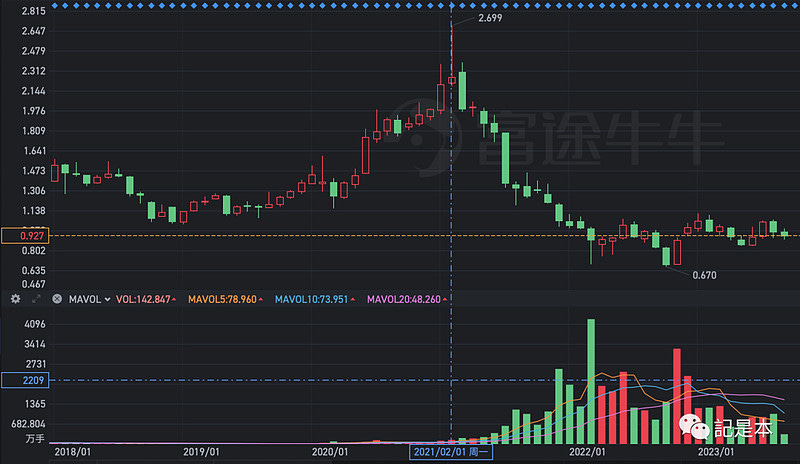
The following chart shows the China Internet Index Fund. Compared to the high of over 2 in January 2021, it is still less than 1, more than 50% off.
Originally, the new users with assets after 2021Q2 would have brought in new incoming assets, but it was still not enough to make up for the asset shrinkage due to the decline in CPS, so total assets have not been able to reach record highs.
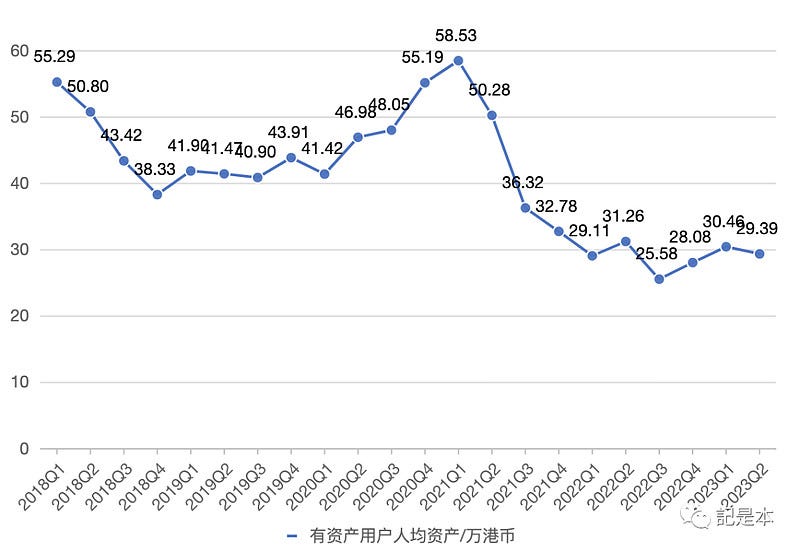
Total assets have not grown, but asset-holding users are still growing, which has led to a decline in assets per capita for asset-holding users from 2021Q1. From the highest per capita of HK$585,300 in 2021Q1 to HK$293,900 in 2023Q2, the decline is nearly 50%, which is also equivalent to 50% off.
UGC
Futu is an ecosystem rather than merely a transaction platform: C-suite users continue to gather and discuss on Futu, which attracts professional investors, and KOLs and analysts follow. On the other hand, listed companies have the need to accurately deliver value, and after discovering the value of Futu's platform, they have also moved in. The media also naturally need to expose their content and interact more with readers. Gradually, the whole ecology grows out.
Early on, Futu founder Li Hua (Leaf) mentioned the three directions of "platformization, socialization and internationalization".
"If we only do trading tools, the moat is not that deep. Tools are easy to replicate at low cost, and in the end, it will definitely turn into a price war. But if you build a platform ecology, there is a natural Matthew effect and network effect, and the strong are stronger and the moat is deeper." said Lion, general manager of Futu's platform product department.
"Users are not that loyal to tools, and are more loyal to the community and some people they have emotional ties to. If you add the social attributes of the platform, so that users can find like-minded friends and have direct contact with listed companies, analysts, Vs, etc., you can greatly increase user stickiness. Users stay, and so do other participants within the platform."
Investors' stickiness to Futu can be seen in the multi-quarter customer retention rate that is higher than 98%. It can be said that Futu is "a platform that you don't want to leave after coming here".

Tiger:an example of a competitor
The main focus here is to analyze the comparison between Futu and Tiger Securities. The table below compares Futu and Tiger on metrics such as clients with assets, client assets, revenue and profit.
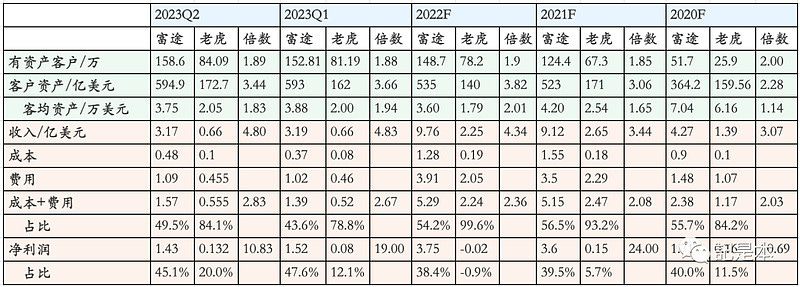
Take 2022 as an example:
1) Number of clients with assets: Futu is 1.487 million, Tiger is 782,000, Futu is 1.9 times more than Tiger.
2) Client assets: Futu is 3.82 times higher than Tiger.
3) Assets per customer: Futu is 2.01 times higher than Tiger.
4) Revenue: Futu is 4.34 times higher than Tiger.
5) Cost+Expense: Futu is 2.36 times higher than Tiger.
6) Net profit: Since Tiger's net profit in 2022 is negative, it is not possible to calculate the multiplier; however, looking at 2020F-2023Q2 as a whole, Futu's total profit is $1.201 billion, Tiger's is $0.05 billion, Futu is about 24 times more profitable than Tiger; or as of the most recent 2023Q2, Futu's profit is 10.83 times more profitable than Tiger.
To summarize, compared to Tiger, Futu has 1.9 times more users with assets, bringing 3.82 times more users with assets, and then reaping 4.34 times more revenue, and finally earning 10~24 times more net profit.
From this, we can distill these figures:
1) Assets per customer: Futu is 2.01 times higher than Tiger. This reflects that Futu's customers are of higher quality.
2) Revenue per asset: Futu is 1.14 times higher than Tiger (4.34/3.82). This reflects Futu's ability to convert client assets into revenue.
3) Net profit per unit of revenue: Futu is 2.30~5.53 times higher than Tiger (10/4.34~24/4.34). This reflects Futu's better ability to control costs and expenses.
Thesis 3: Expanding into global markets
Ahead of schedule entering Japan market.
Futu’s moomoo announced the launch of its online brokerage business in Japan from Sep 19, 2023, ahead of its prior schedule to launch in 4Q23. Japanese investors can now trade around 7,000 US stocks and ETFs on the moomoo platform, which represents the highest level of tradeable US shares among Japan online brokers. Notably, moomoo’s commission fee of US$0.0099 per share is lower than the top-five Japanese online brokers’ fees of 0.45% of contract price, per company data. moomoo charges the same commission fee for trading US stocks as it does in its other countries of operation. Futu plans to provide trading services for Japan stocks in 1Q24, and MFSL and derivative products for Japan investors in 2024.
Increasing number of active users and strong user engagement since launch of trading.
In Japan, the top-five online brokers – SBI Securities, Rakuten Securities, Monex, au Kabucom Securities and Matsui – accounted for 43%/ 33%/ 9.3%/ 7.7%/ 4.4% of domestic trading volume among online brokers, and they had more than 24mn total accounts as of Mar 2023, per company data. The moomoo Japan app had 258,815 active users in Sep 2023 (including both Android and iPhone), up by 14.1x since Feb 2023, according to data.ai, while its active users accounted for 27% of the Android installed base, higher than the 21% average during Feb-Aug 2023, suggesting the launch of trading functions further increased user engagement. I compared moomoo’s number of active users with its closest peers in Japan and it ranked behind only Rakuten’s iSpeed and SBI, while surpassing SBI’s dedicated US stocks app in Sep 2023, per data.ai, which I see as a positive sign so soon after launch of trading functions. moomoo also had a relatively high user engagement rate at 27%, slightly behind SBI’s and Rakuten’s 31-39%, yet much higher than others’ 1-13%. According to moomoo Japan, it quickly reached more than 5,000 applicants in Sep 2023, averaging 200 applicants per day, on my calculations. Based on this run rate, I forecast Futu could acquire at least 15,000 new paying clients in Japan in 4Q23E.
Valuation
Having completed the introduction of Futu's revenue, profit, users and competitors above, we will now attempt to value Futu.
The difficulty in valuing Futu is that Futu is both cyclical and growth-oriented.
Cyclicality is reflected in the fact that Futu's revenue is greatly affected by the market environment. Firstly, the market trading activity: when the market is in a bull market, the trading volume will increase and Futu's revenue will grow; when the market is in a bear market, the trading volume will decrease and Futu's revenue will fall. Next is the market interest rate: when the market interest rate is high, other things being equal, the interest income will increase; when the market interest rate is low, the interest income will decrease. And neither market trading activity nor market interest rates can be predicted, so this part can be seen as cyclical.
Growth, on the other hand, is reflected in the fact that Futu is still in the process of expansion, actively expanding overseas markets, and the number of users with assets is still increasing. All other factors affecting revenue remain unchanged, new users will bring in more money and revenue, which in turn will translate into more net profit, thus reflecting Futu's growth.
The valuation of a cyclical stock can be done by using the Shiller P/E valuation method: the average profit of the past 5 to 10 years is used for valuation. So how should we consider Futu's growth in a comprehensive way?
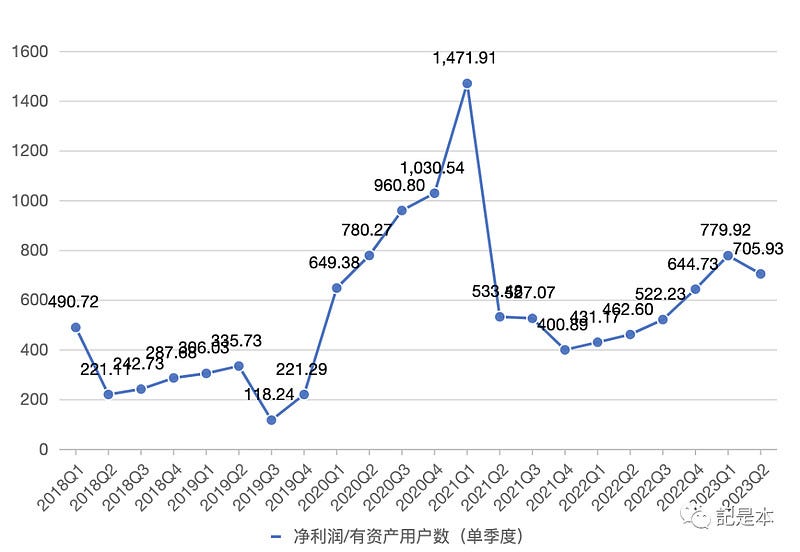
Here, what I think of is to use the average profit of the past 5-10 years brought to Futu by a single asset user to reflect the cyclicality, and the current number of asset users of Futu to reflect the growth, that is:
Profit = Average profit brought to Futu by a single asset-holding user over the past 5 to 10 years * Current number of asset-holding users
The chart below shows the single quarterly net profit (in HKD) contributed to Futu by a single asset-owning user since 2018Q1, demonstrating the cyclicality in response to the changing market environment.
And the chart below shows the growth reflected in the growing number of users with assets.

Now, we are ready to value Futu
1) Over the past 22 quarters, the average profit contributed to Futu by a single subscriber with assets is HK$551/quarter, or HK$2,204/year.
2) Multiply this by the current number of equity users, 1,586,001, and Futu's net profit for valuation purposes for the coming year is HK$3,495.5 million. Using the current USD/HKD exchange rate of 7.82, the net profit is US$447 million (US$447 million).
(3) If we give Futu a reasonable valuation of 20 times PE, the reasonable valuation of Futu is 8.94 billion dollars, divided by 140 million shares, the share price corresponding to the reasonable valuation is 63.85 dollars.
Considering a certain margin of safety, generally speaking, 70% of the reasonable valuation can be used as a buy point. However, considering the fact that Futu's revenue related to mainland users accounts for 44% (H1 2022), there is a compliance risk in this part.
Therefore, a higher margin of safety is considered here, taking 44% margin of safety, which corresponds to an ideal buy point of 8.94 * 56% = $5 billion, corresponding to a stock price of $35.8.
Sell at 1.5 times reasonable valuation: $8.94 * 1.5 = $13.41 billion, corresponding to a share price of $95.78.
Growth is hard to measure, especially under the condition that Futu is under strong regulation risk and macroeconomic risk. So we do not take into account growth in the valuation.
Risk
Regulation risk
We all know that Futu's customer acquisition on the mainland is a compliance risk, so how do we estimate the size of this risk? The key is the current number of mainland subscribers and the impact on revenue. This part of information can exactly be disclosed on page 338 of this Futu announcement below.
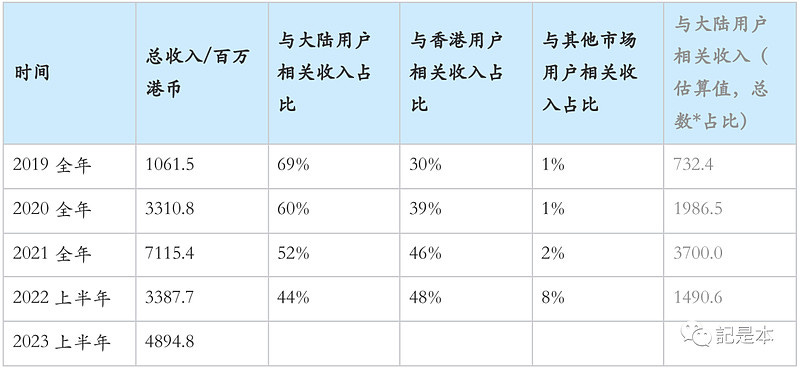
Overall, the number of mainland users with assets and the revenue related to mainland users are shown in the following two tables. In the tables, the black font is the real value and the gray font is the estimated value.
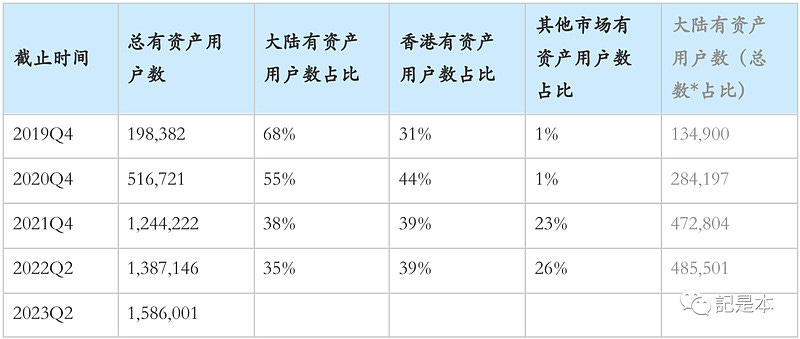
It can be seen that the share of the number of users with assets in the continent decreased from 68% in 2019Q4 to 35% in 2022Q2, while the number of people increased from 135,000 to 486,000. On the one hand, the growth in the number of mainland users with assets is high in absolute terms, but on the other hand the percentage is decreasing. This indicates that Futu has seen more growth in the number of new users in other regions in recent years. In other words, in terms of numbers, Futu will rely less and less on mainland users.
As can be seen from the table below, the share of revenue related to mainland users is also gradually declining, having fallen from 69% for the full year 2019 to 44% in the first half of 2022. Coupled with the fact that according to the information in Futu's financial report, more than 90% of the new users with assets added so far in the second half of 2022 are outside the mainland, and Futu is vigorously expanding into overseas markets (e.g., Singapore, Australia, Canada, Japan, etc.), it is reasonable to believe that the percentage of revenue related to mainland users will get a sustained decline in the future.
Macroeconomic risk
Market downturn and reduced participation of retail investors. Retail investors could be discouraged from investing and wait on the sidelines during a weak market, leading to lower trading velocity and trading volume. As a result, this could pressure Futu’s brokerage business and reduce its commission income.
Intensifying competition risk
More aggressive pricing competition on commission rates and margin financing rates from other online brokers may affect Futu’s pricing strategy and impact its market share. This could lead to lower-than-expected user growth and a lower profit margin.
Slower-than-expected overseas expansion risk
If overseas expansion in Singapore, the US, Australia, Japan, and Malaysia does not proceed at the pace expected by management, user growth may be lower than we expect and would negatively affect our earnings growth forecasts for Futu.
Source
Wechat official account, Wind, Xueqiu, Research paper of Huaxing Capital, Futu financial report
*Do note that all of this is for information only and should not be taken as investment advice. If you should choose to invest in any of the stocks, you do so at your own risk.