


Initial Report: Jinko Solar Holding Co. (JKS), 177% 5-yr Potential Upside (EIP, Leon LEONG)
Leon has conviction in JKS's strong and improving fundamentals that will continue to allow the company to tide through this difficult period.


Company Overview
Established in June 2006 in Shanghai, China, and publicly listed on NYSE in 2010, Jinko Solar Holding Co. (JKS) is one of the leading solar technology companies in the world today that is engaged in the manufacturing process of all the key stages within the solar PV supply chain. In fact, JKS pioneered the vertical integration capacity from the manufacturing of silicon ingots and wafers to cell and module production. It also engages in the recovery of upstream silicon materials used in the manufacturing processes.

JKS' total revenue leapt in FY22, with a 104% YoY increase compared to FY21, recording a total revenue of RMB 82,127mil. This was largely contributed by the sharp acceleration of the company's module shipments to 44,250 MW in FY22, an increase of 100% compared to FY21.
Using the actual 1Q-3Q23 of JKS's earnings results and management's guidance of module shipments in 4Q23, JKS's FY23 module shipment is expected to be around 75,000 MW, a 69% YoY expected increase compared to FY22's shipments. Consequently, JKS is expected to clock total revenue of RMB 120,570mil in FY23, a 45% increase compared to FY22.


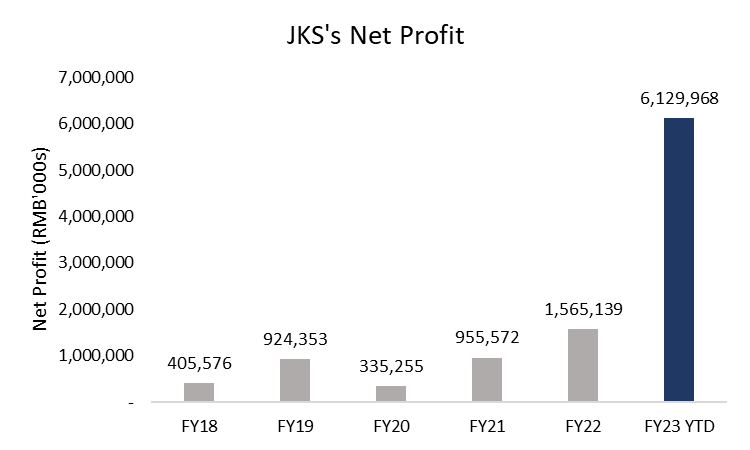
Net income has generally been increasing over the past five years as well (Figure 4), with the exception of FY20 and FY21 despite the growth in module shipments and total revenue. FY20's net income declined due to a massive decline in fair value of the company's convertible senior notes (~RMB 725mil) while FY21's net income growth was unspectacular due to a compression of gross margin to 16% in FY21, from about 18% in both FY19 and FY20.

Business Segments & Revenue Breakdown
JKS primarily sells its manufactured solar modules to solar project developers and consumers (solar rooftop installations) from over 180 countries, while selling some of its unused solar wafers, cells and recovered silicon materials to other manufacturers of solar power products. It also recently ventured into the Energy Storage System (ESS) business in 2022, providing residential, commercial and industrial ESS solutions to power suppliers and distributors, which has helped the company package its PV products with ESS solutions to some of its customers. While it has historically been engaged in developing solar power projects of its own to generate and sell electricity in China and overseas, it has since disposed of the majority of these downstream solar power projects in 2016 and 2018 respectively, leaving behind one operating solar power plant in Abu Dhabi and one in Mexico that is still under construction.
For the past three years, its solar module sales constituted over 90% of its total generated revenue, with a 97% revenue contribution in FY22 while sales of solar cells, wafers and other solar materials (including ESS) contributed to 3%.
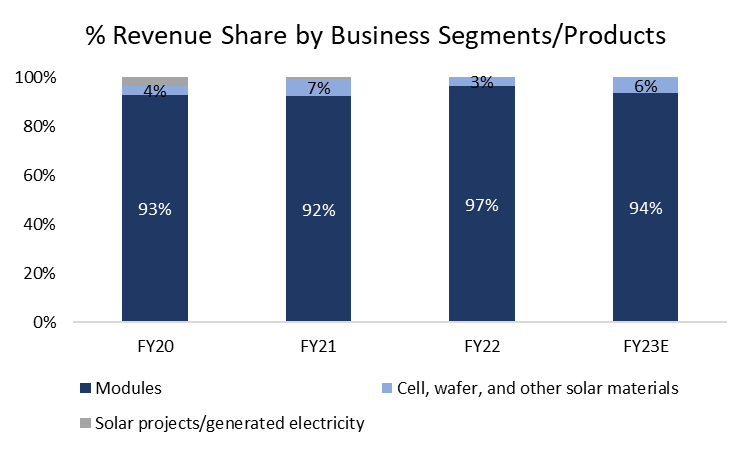
Moving forward, its solar projects business's contribution to total revenue will likely be insignificant relative to its focus on module sales, with possibilities that the remaining two solar power projects will be disposed of in the near future.
Concurrently, its new venture into the ESS business creates greater growth opportunities, with a 13% CAGR potential in annual added capacity from 2023 (110-140 GW) to 2030 (520-700 GW), driven by the need for energy consumption optimization and a backup power source due to renewable energy's inherent intermittency (e.g. solar energy generation dependent on sunlight, wind energy generation dependent on wind speed). However, given its late entrance into the fragmented ESS market, it remains to be seen if JKS has the capability to scale its ESS business and develop an edge against other more experienced ESS providers; more diligence on ESS business's performance needs to be conducted in the following few quarters.
With respect to geography, total revenue derived from China has increased tremendously from 18% in FY20 to 42% in FY22, while APAC and North America share of revenue has declined in the prior three periods (Figure 6).
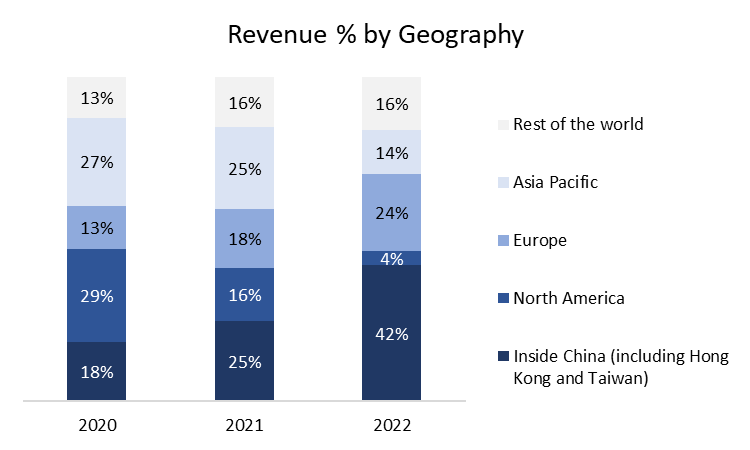
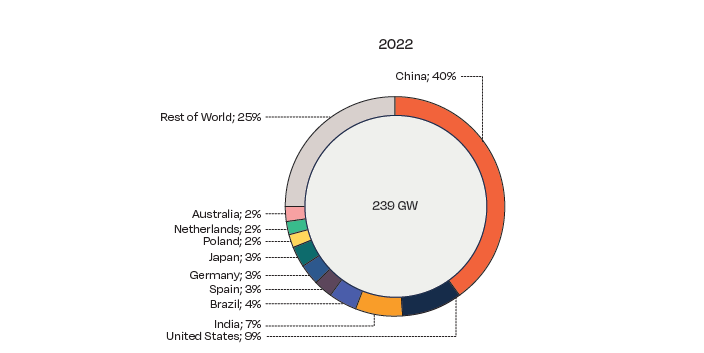
China is likely to remain as the leading country that JKS supplies its modules to in the coming years, given China's sheer dominance in global solar PV installed capacity (Figure 7) and annual solar PV installations (Figure 8). This presents a sizable opportunity for JKS and is further supported by the company's ongoing construction of its super integration solar base in Shanxi, which boasts a total manufacturing capacity of 56,000 MW, the largest N-type integrated production facility in the industry. 28,000 MW is expected to be operational by end FY24 while 56,000 MW will be operational by FY25, which I expect will further solidify their market share for solar modules as they ramp up on N-type technology which is gaining traction as the prevailing solar module technology.

Products Breakdown


Tiger Neo is JKS's N-Type Tunnel Oxide Passivated Contact (TOPCon) modules, which generally have a higher efficiency compared to P-Type solar modules, thus being able to convert photovoltaic rays into power more efficiently. Additionally, N-type modules are doped with phosphorus, which has one more electron than silicon, making the solar cells negatively charged and thus is most resistant to degradation from exposure to sunlight and oxygen in the air, which reduces degradation rate significantly.

The lower temperature coefficient of N-Type modules also allows the N-type modules to generate more power than P-Type under high temperature conditions. -0.29%/℃ temperature coefficient indicates 0.29% of power output lost for each ℃ increase in temperature beyond 25℃, therefore the lower the better.
Tiger Pro is JKS's P-Type Passivated Emitter and Rear Contact (PERC) module, which has lower efficiency than Tiger Neo modules and also suffers from greater degradation.
Tiger and Cheetah are older variations of Tiger Pro, which are also made up of P-Type solar cells, but have lower maximum power output and efficiency. However, this may be more suitable for consumers that are looking to install rooftop solar and do not need to generate as much power as those required in utility, commercial and industrial scale solar plants.
Energy Storage System (ESS)

JKS initiated its ESS business in 2022, and it remains a key aspect of its business plan to further develop this business segment through strategic cooperation with various power suppliers and distributors. It currently features four LFP battery ESS across utility, commercial, industrial and residential uses. However, there is insufficient information available on its revenue contribution within its total revenue mix, thus this ESS segment remains a potential growth area to be diligenced.
Revenue Drivers
There are two key metrics that drive total revenue:
1) Shipments in watt units
2) Revenue/watt units
Module shipment is influenced by technological advantage and demand of the company's modules and is contingent on the company's market share of annual installed solar PV capacity in the world. As a general rule of thumb, the company's ability to retain or even increase its market share, and continue to scale its production and shipments relies on its continued expansion of manufacturing capacity (e.g. Building more manufacturing plants). To date, the company has sufficiently increased its manufacturing capacity to accommodate increasing solar module demand, where FY23's expected total module shipments (75,185 MW under mgmt's guidance) will likely remain within FY23's expected cell, wafer and module manufacturing capacities (85,000MW, 90,000MW, 110,000MW respectively).


It is also worth noting that JKS began manufacturing and selling of its N-type solar modules after 23Q1, which scaled up to 25% of total module shipments in FY22. In FY23, the company continued to scale up its N-type solar module production and total N-type module shipment is expected to reach 60% of total module shipments by the end of FY23. N-type modules (TOPCon technology) have a higher energy conversion efficiency compared to P-type modules (e.g. PERC technology), and is expected to become the prevailing solar module technology in the near to medium term due to efficiency advantages and rising demand amidst a price convergence between both technologies. The company's steadfast entrance into this emerging trend will allow it to better position itself in the market as demand for P-type solar modules diminishes and demand for N-type modules accelerates.
JKS's implied market share (shipments as a % of total installed solar PV capacity for respective periods) has generally increased over the past 5 years, from 12% in FY18 to 19% in FY22 and is expected to hit 22% in FY23 (Figure 11). Unsurprisingly, its implied revenue/MW module shipment has been declining from FY18 to FY22, and is expected to dip further in FY23 (Figure 12). This is largely due to increasing supply of modules available on the market and the onset of a module overcapacity issue as supply exceeds demand. In the short to medium term, I believe there will be further compression of solar module prices, but JKS should be able to defend its market share with their continued strategic capacity expansion and adaptability to shifting solar module technology. This should result in an industry consolidation where weaker solar module manufacturers are forced to exit the market while competitive players, such as JKS will continue to thrive in the medium to long term.


Cost Drivers
As downstream solar project constructions have increased over the years, cost of raw materials used by JKS, such as polysilicon and photovoltaic glass coating have decreased as well due to increasing supply. Additionally, anciliary materials like aluminium from China used in the production of solar modules have continuously declined as well (Figure 13). Gross margin has been volatile but there has been a slight recovery in the first 9 months of 2023, from ~14% in 2022 to ~18-19% (Figure 14). It appears that costs of raw materials have declined at a faster rate than the price of modules sold by JKS, and the fact that JKS sells mainly solar modules (>90% of total revenue) allows it to better protect its margins in light of falling solar prices, unlike some solar players (e.g. Longi Green) that sell a large amount of solar cells and wafers which take up a larger proportion of their total sales.


Operating expenses have decreased substantially in the first 9 months of 2023, which is a testament to JKS's cost control efforts in light of falling solar module prices across the industry. While EBIT margin has fallen from 2020 till 2022 due to higher operational costs, it appears that the company has managed to subdue the rising operational costs in the first nine months of FY23. Continuing this trend till the end of FY23, it remains realistic that JKS's full year ebit margin can hit 5.4% by the end of the year (Figure 17).


ESG Considerations and Assessment
While JKS has responded to several ESG initiatives and have created a materiality map with key ESG concerns to evaluate the company's future ESG roadmap, the company did not set tangible and concrete targets across many of the ESG concerns/metrics identified in their materiality map. Nonetheless, it does seem like JKS has been advancing their advocacy for ESG.
There are several initiatives that JKS has responded to:
1) Science Based Target Initiatives (SBTI): Undertook to establish science-based emission reduction targets and strive to achieve "net-zero emissions by 2050"
2) RE100 Initiative: Undertake to deploy the energy management system to all operational segments by 2030
3) Sustainable Markets Initiative: Founding member of the SMI and has joined the SMI China Council to help the chinese business community make China's voice heard and put forward China's proposal in global economic and environmental governance chnages
4) United Nations Global Compact (UNGC): Undertook to fulfil the Ten principles of the UN Global Compact based on United Nations conventions, covering the areas of human rights, labour, environment, anti-corruption, and report progress annually
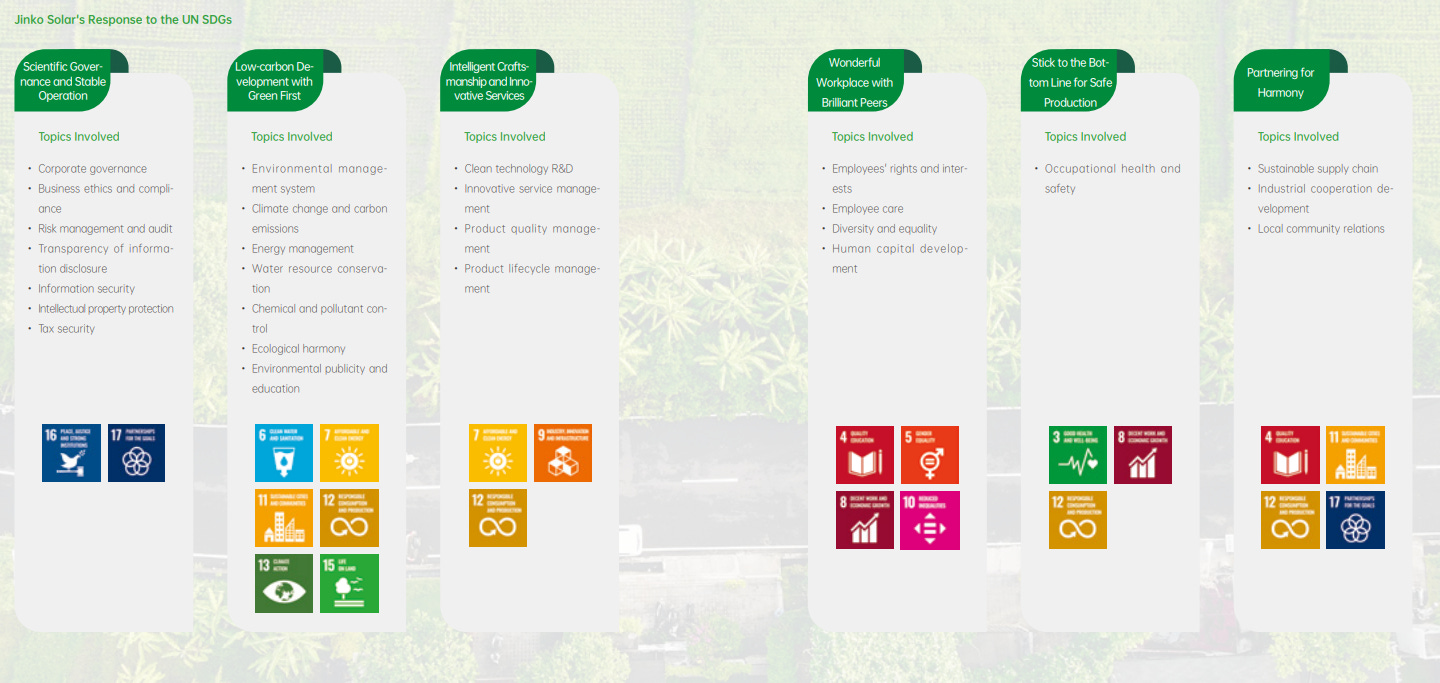
The following depicts the company's ESG materiality map in 2022:


However, the only quantified target that I could find is regarding its:
1) Emission reduction targets
Reduce absolute Scope 1 and 2 GHG emissions by 50.4% by 2032 (with 2022 as base year)
Reduce Scope 3 GHG emissions from purchased silicon, glass, frame, cell, solar EVA, book-sheet, solder strip and solar modules, cells and silicon wafers produced by 58.2% by 2032 (with 2022 as base year)
More needs to be done by the company in setting targets for other key material ESG issues for future quantification and measurement of progress.
Furthermore, while JKS has been transparent on certain environmental performance figures (natural gas consumption, raw water consumption, waste discharge), they are in absolute figures which make it difficult to conduct any meaningful comparisons on whether they are improving or worsening without accounting for production volume. JKS can do better by disclosing these performance figures relative to production volume for more meaningful assessments on their environmental performance in the future.
Something else worth noting is that JKS has responded to the United Nations Sustainable Development Goals, combining it with their own business value chain and actively aligning the company's operations to SDGs goals.
JKS has also actively sought to invest in construction and upgrading of environmental management systems based on the ISO 14001 environmental management system, with 10 out of 14 manufacturing bases certified by ISO 14001 as of 2022. The same 10 bases have also been certified with relation to ISO 45001 on safety related management systems which safeguards the company's occupational health and safety management. These further illustrate their commitment to strengthen their environmental and social performance.


However, on the social front, the total number of male employees currently dominates that of female employees (72% male vs 28% female), which indicates a lack of gender diversity. While unlikely to have significant impacts on the company's operations, management could do better in improving the gender diversity of its workforce.
Governance
The board of directors comprises of 7 members, 3 of whom are independent
Xiande Li (CEO and Board Chairman) - 48 Years Old
Xianhua Li (Director) - 49 Years Old
Wing Keong Siew (Independent Director) - 72 Years Old
Steven Markscheid (Independent Director) - 69 Years Old
Yingqiu Liu (Independent Director) - 73 Years Old
Haiyun Cao (Director) - 46 Years Old
Mengmeng Li (Chief Financial Officer) - 42 Years Old
Independent directors constitute over a third of the board with diverse experiences across investment services, business development and economics research. A lean board can also be beneficial for decision making with lower risks of conflicts of interests, which can help the company rapidly adapt and make corporate decisions in the turbulent solar market today. Furthermore, with nearly half of directors being independent, the decisions made are more likely to be objective rather than biased, which can be beneficial for shareholders.
While JKS has in place a well-developed governance structure (Figure 24), the CEO (Xiande Li) also holds the position of board chairman and has a seat in both the nomination and renumeration committees. This increases the risk of exposure to abuse of power since Xiande Li can effectively influence the activities of the board and has a degree of control in setting executive compensation (which can be biased towards incentivizing himself and the company's executives). It seems like there are no issues regarding conflicts of interests for now, but I am a little uncomfortable with the power that Xiande Li has.

In terms of share ownership (Figure 25), insider ownership is around 34% (including Kangping Chen's share), with Xiande Li owning 15.5% of the total shares. This provides me with some confidence that Xiande Li, as both CEO and Board Chairman, has an incentive to make corporate decisions that create shareholder value and acts as a mitigant of some degree to the risks of potential conflicts of interest between management and shareholders.

Overall ESG stance: there are some concerns and room for improvements:
Environmental: JKS can do better by including quantifiable targets for key environmental issues measuring its progress towards these targets
Social: JKS can strive for greater gender diversity in its workforce
Governance: CEO Xiande Li has too much power as both board chairman and CEO, and has a seat in nomination and renumeration committees., which could heighten risks of conflict of interests
Industry Analysis
Figure 26 shows a simple solar industry supply chain map, with JKS positioned within the mid-stream of the chain.

Recent turbulent macroeconomic and geopolitical events, such as the Russia-Ukraine war, have driven national leaders' urgency to increase energy security and steer towards clean energy generation on top of the need to drive greater initiatives towards net zero goals. Consequently, national leaders have implemented policies (e..g China's 14th 5-year plan, U.S Inflation Reduction Act, REPowerEU) that have created a structurally attractive environment for the construction of commercial and industrial renewable projects, as well as consumers that are incentivized to opt for renewable energy generation. With solar power having the second lowest levelized cost of energy amongst other renewable types, it has been no surprise that downstream demand has increased significantly in the past three years, with China taking up the bulk of new capacity installations from 2020 to 2022 (Figure 27).
As a result, demand for solar modules has accelerated and many solar module manufacturers have sought to rapidly expand their manufacturing capacities through new plant constructions, which has continuously led to decreasing prices of solar modules. This has in turn contributed to the market's fear of solar overcapacity, which could compress solar module manufacturers' profits in the near to medium term and potentially the bankruptcy of many players. However, I believe that JKS's leading market position and relatively healthy balance sheet would allow it to tide through this difficult period while the industry consolidates.

SolarPower Europe has projected a double digit annual growth in solar PV capacity in their medium scenario from 2022 to 2027 (Figure 28), with China remaining as the largest market for capacity additions (Figure 29). This will benefit Chinese module manufacturers and continue to drive up orders as solar installations increase across residential, commercial, and utility-scale projects.
The US has also became an attractive market with the initiation of its Inflation Reduction Act in 2022, providing advanced manufacturing tax credits to renewable components manufacturers and project developers of upwards to 30%, which slowly tapers off till 2032.
One important point to note is that Chinese solar manufacturers that have manufacturing plants in the US are also entitled to these tax credits for the production of solar modules within the US, which acts as a profitability lever for them. They can also continue to expand their manufacturing bases within the US for the time being, but this may be subjected to change in the future.
I've also seen some concerns over the US potentially restricting solar module imports in the future to further strengthen its domestic production capabilities and protect its domestic manufacturers. However, this is unlikely to happen at the moment given the lower prices of Chinese solar modules and US-based manufacturers are still in the beginning phases of ramping up their manufacturing capacity. US-manufacturers' module supply may fall short of US's short-medium term module demand, and Chinese manufacturers' solar modules will still be needed, at least in the short-medium term, to accommodate downstream demand and ensure that the US can install new solar capacities at a reasonable pace.


While the solar module market consists of various types of technologies, the three most prominent are 1) P-Type PERC, 2) N-Type TOPCon, and 3) Heterojunction Technology (HJT). Historically, the market has largely been dominated by P-type PERC due to attractive LCOE and adequate efficiency levels. However, with the convergence of P-Type and N-Type technology over the recent years, N-Type technology has been rapidly gaining traction due to decreasing costs and higher efficiency, which has propelled their demand from project developers and consumers. By 2026, TOPCon technology is expected to occupy 62% of total capacity in the industry as P-Type module demand begins to fade. While HJT modules have the highest efficiency amongst the three technologies, its cost premium has rendered it unattractive at the moment, given project developers' sensitivity to costs and returns potential.
Thus, the manufacturer that can manage to accelerate its N-Type manufacturing capacity and leverage the experience curve in the short to medium term will get to maintain a narrow technological moat and competitive advantage against its competitors.


Competitive Landscape & Analysis
The four largest players amongst solar module manufacturers are Longi Green Technology, Jinko Solar, Trina Solar, and JA Solar, which are all headquartered in China and are the most comparable in terms of operational scale.
JKS has proven itself as a fast-rising contender amongst solar module manufacturers, increasing its module shipments from 22,230 MW in 2021 to 52,185 MW in FY23 YTD (Figure 30), which exemplifies its extraordinary growth in recent years while its competitors' shipment growth has slowed. In FY23 YTD, JKS officially shipped the greatest amount of solar modules in the industry (by MW), and has rose the ranks from the fourth position in terms of module shipments to the first position amongst its most comparable competitors.
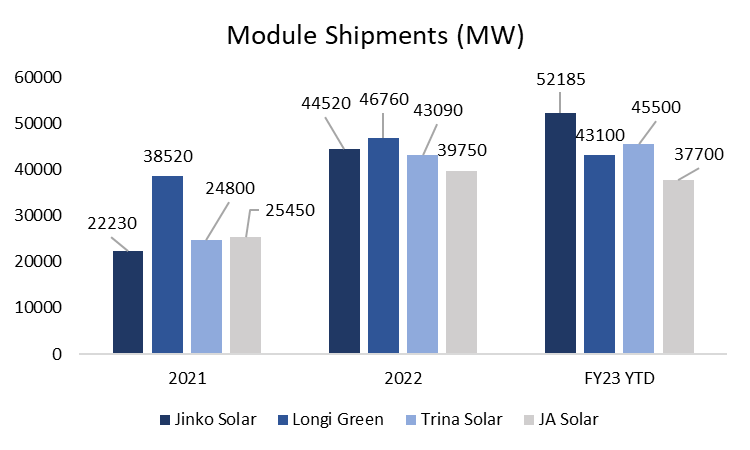

However, one thing to take into account to is Longi Green's different product mix compared to the other 3 manufacturers. Longi Green's sales model includes a large proportion of wafer shipments (Figure 31), which is even greater than its module shipments, whereas JKS's wafer shipments account for a small % of its total shipment mix. Trina Solar and JA Solar, on the other hand, appear to not distribute and sell the wafers that they produce, which are presumably all used in the manufacturing process of their solar modules. Thus, when comparing the financial metrics of these four solar players, it is important to take note that Longi Green's metrics might differ from the others due to the different pricing and cost structure of solar wafers.
When I think about the economic moat of a company within an industry, I look from the verticals of value proposition and cost efficiency of the company. In the case of a solar module manufacturer, the value proposition of its solar modules depends on a variety of metrics (e.g. Annual expected degradation, power warranty, temperature coefficient, etc..). However, perhaps the most important contributors to the value perceived by potential customers are 1) Module efficiency (e.g. how efficient photovoltaic rays from the sun is converted into power, and 2) Price of the modules, which impacts project developers' profitability and returns
Module efficiency is heavily dependent on a solar manufacturer's R&D efforts and continuous innovation to create solar cells of greater efficiency. Multiple solar cells are then attached together to create a solar module.
As mentioned earlier, N-Type TOPCon solar cells are becoming the prevailing technology within the solar industry, boasting higher efficiency than PERC cells, lower annual degradation, and lower temperature coefficient, which increasingly allows the cells and module to maintain their efficiency at higher temperatures. This has become an important factor for solar projects in areas with hot climates.
Furthermore, with prices between PERC and TOPCon cells and modules converging rapidly with rising demand by utility and commercial customers, a solar module manufacturer's value proposition is now heavily centered on assembling N-type TOPCon modules that have the greatest efficiency, and ensuring that N-Type manufacturing capacity is sufficiently large enough to accommodate rapidly rising demand, as project developers usually procure and install solar modules from a single supplier for the entirety of a project.
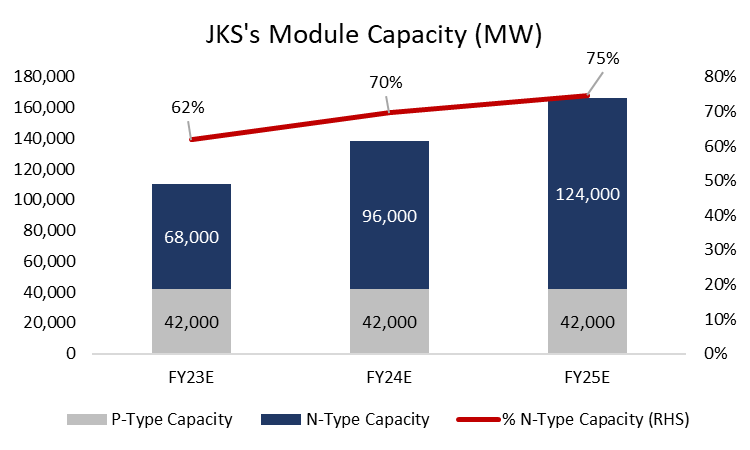
JKS has done exceptionally well in this aspect, with 68,000 MW of N-Type production capacity as of Q3 2023 (Figure 32), around 62% of total module production capacity. While JA solar has 76% of total module production capacity as N-Type capacity, its absolute n-type production capacity still falls short of JKS's. While I couldn't manage to find Longi Green's N-Type production capacity from publicly available sources, I take comfort that JKS still remains as one of the most competitive N-type module manufacturers even if Longi does have a greater N-Type production capacity than JKS.

To remain competitive in increasing production capacity, a module manufacturer needs to increasingly invest in capital expenditures. To that end, JKS has expanded more aggressively than its peers in the prior two years (Figure 33), but its peers have started to accelerate CAPEX in 2023 with the increasing competitiveness to grab market share. As of FY23 YTD, Longi Green has the highest module manufacturing capacity, but total shipments as % of total manufacturing capacity is the lowest amongst peers at 33% (Figure 34). On the other hand, JKS ranks second in terms of manufacturing capacity, but shipments stand at 47% of total manufacturing capacity. It appears that JKS's expansion has done relatively well compared to Longi Green, while absolute manufacturing capacity is way ahead of Trina Solar and JA Solar.
Overall, in terms of manufacturing capacity and N-type TOPCon transition capabilities, JKS is well positioned amongst its peers to benefit from increasing solar installations and module demands in the coming years. One danger, however, is the falling prices from overcapacity in the solar industry, which could make aggressive expansion and CAPEX increasingly risky if profitability falls drastically in the coming few years.


In terms of technological moat and module efficiency, my general take is that there is only a narrow technological moat within the solar industry. Competitors are continually increasing R&D and innovation efforts and increasing the efficiency of their solar cells, wafers and modules. When one manufacturer successfully invents a new, higher efficiency module, it will not be long before another competitor catches up and creates something better.
In terms of module prices, it seems like module manufacturers are price takers, where we have witnessed solar module prices decreasing across the board due to overcapacity. It should be likely that solar modules from module manufacturers fluctuate around a similar range and remain largely a function of market demand and supply. No one is likely to undercut prices as it generally makes every manufacturer worse off, while the narrow technological moat does not warrant any significant price increases as customers (e.g. Solar project developers) are concerned about their profitability and returns.
Thus, value proposition of a module manufacturer relies more on relationships and satisfaction of its existing and previous customers, who are more likely to re-purchase solar modules for new solar projects if their previous orders for a previous project have been satisfactory. With respect to this, manufacturing capacity is equally important to ensure sufficient production to accommodate accelerating demand from existing and new customers, which contributes greatly to a module manufacturer's value proposition. Moreover, the learning curve inherent in developing N-Type technology allows leading manufacturers to maintain a narrow moat compared to its peers.
Evidently, from FY23 YTD's module shipments, JKS takes the crown and makes me believe that customers are leaning towards JKS's solar modules, and remains a positive signal for the growth trajectory of JKS's future shipments. Manufacturing capacity and CAPEX of JKS also remain one of the highest amongst its peers, signalling management's optimism for future demand and ability of the company to grab greater market share.
In terms of costs, JKS's gross margin in FY22 has been on par with its peers (Figure 35), but has lagged behind in FY23 as JA Solar and Longi Green have managed to reduce their raw material costs more than what JKS has done. However, Longi Green's sales mix includes a large proportion of solar wafers, which may have contributed to the large variance in its gross margins compared to the rest.


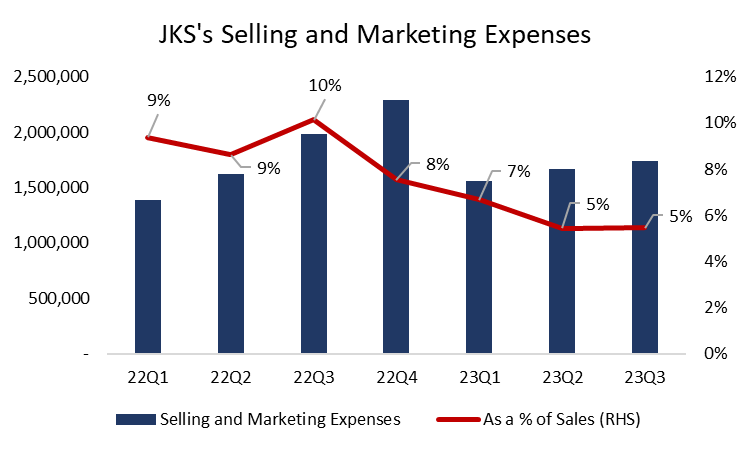
In terms of net profit margins, JKS has done exceptionally well in controlling its operating costs in FY23 and we can see a clear recovery trajectory in net profit margin compared to FY22 (Figure 36). On the other hand, all of its peers have seen net profit margins decline in FY23, signalling poorer control of operating costs, which is worsened by declining solar prices across the entire value chain. While JKS's gross margin expansion has certainly contributed to alleviating its poor profit margins as seen in FY22, another key contributor is its reduction in selling and marketing expenses as a % of sales in the first three quarters of 2023 (Figure 37). This is a key critical point as JKS's module shipments have increased significantly while expenses incurred to market and sell its modules have not increased significantly, implying JKS's stronger presence amongst customers that are looking to purchase solar modules.
With increasing module shipments, JKS appears to have a solid value proposition alongside tight cost control efforts, providing it with a narrow economic moat amongst its peers. JKS's future looks promising even as the solar industry is faced with overcapacity pressures, and I believe it is well positioned in the solar industry to weather through the period of overcapacity and emerge as the leading solar module supplier after the industry consolidates.
To remain objective in my analysis, I have found some apparent weaknesses in JKS compared to its peers. Most notably, it is highly leveraged compared to its peers, with 42% debt-to-asset ratio as of FY23 YTD (Figure 38). JKS has aggressively expanded its manufacturing capacity with the utilization of debt over the years, which significantly increases default risks if the company's module shipments and module prices fall in light of the solar industry's overcapacity issue. Fortunately, we have seen that in FY23, the Debt/EBITDA ratio of JKS has steadily declined (Figure 39) due to increasing profitability of the company from increasing module shipments and tight cost control efforts. Nonetheless, this remains a key weakness for JKS, especially when prices of solar modules are expected to decline in the short to medium term, which could impact the company's solvency if JKS continues to issue debt to accelerate capacity expansion.


I am also reassured to a certain degree by JKS's increasing cash flow from operations in FY23 (Figure 40), while its peers' operating cash flow generation capabilities have declined substantially. With CAPEX spend being discretionary and a steadily increasing cash flow generation capability, JKS is unlikely to become insolvent despite its highly leveraged profile and from the risks of decreasing industry profitability. JKS's interest coverage ratio has also increased dramatically in FY23, compared to a measly 0.74x in FY22 (Figure 41), which further strengthens my conviction in their ability to meet short term interest obligations on top of their long term debt repayment.


Another important point is JKS's R&D investment glaringly lagging behind its peers, at 0.7% of sales in FY23 YTD (Figure 42), which can be detrimental to its capabilities in retaining its technological moat in the future. However, it does appear that demand for JKS's solar module is still going strong, evident from its outperformance in module shipments in FY23 YTD despite lesser investments in R&D compared to its peers. In fact, while R&D investments have lagged behind its peers from 2020 to 2022, its module shipments have accelerated consistently while module shipment growth of its peers has increased at a much slower pace. This gives me a reason to believe that they are more efficient in converting R&D investments to payoffs, and can play a critical role in sustaining its module shipment growth while controlling their operational costs in light of decreasing solar module prices. This can be an advantage for JKS.

Investment Thesis
1) Narrow technological moat amongst solar module manufacturers creates an opportunity to maintain market share as competition intensifies; JKS's shipments expected to grow healthily
JKS's recent accomplishments and steadfast expansion of N-Type manufacturing capacity has provided it a narrow competitive edge against its competitors, ranking first in the industry from shipments of 30GW of N-Type TOPCon modules in 1H 2023, and is the first in the industry to deliver a cumulative 190GW of solar modules globally as of 3Q 2023.
As mentioned in the competitive landscape analysis above, JKS stands strong with the highest absolute N-Type manufacturing capacity today, and has obsessively expanded its manufacturing capacity in anticipation of an acceleration in solar installations and module demands.
On top of its current dominant position amongst its competitors, JKS commenced construction of its Super-Integrated N-Type Solar Base in Shanxi, China, in September 2023. This manufacturing base will be the largest N-Type manufacturing facility in the entire world, boasting a 56GW manufacturing capacity expansion across wafer, cell and module (28 GW is expected to operational by end 2024 and the other 28GW is expected to be operational by end 2025). If the expansion goes according to plan, JKS's N-Type capacity will nearly double by end FY25 (Figure 43), which I believe will continue to strengthen its value proposition and accommodate rising demand from project developers.
In my base case projections, I utilised SolarPower Europe's forecast for global solar capacity installations, which will continue to grow over 15% annually (Figure 44). With its leading N-Type capacity expansion and continuous innovation in module efficiency, I believe it can retain its market share in the next 2 years, or at the very least, mitigate market share losses from increasing competition within the industry. Thus, I expect JKS's market share in terms of shipments to decline moderately in the next 2 years, before recovering as an overcapacity in the industry will push out weaker players and lead to industry consolidation. Thereafter, I expect market share to increase again from FY26, which would contribute to continuous increases in JKS's module shipments in the next 5 years (Figure 45).


2) Grossly mispriced opportunity from excessive pessimism around solar overcapacity and China's economic downturn; yet fundamentals remain strong while profitability is gaining visibility
While the market's fear of overcapacity in the solar industry is warranted, I couldn't help but feel that the pessimism for solar module manufacturers has been exacerbated by excessive capital outflows from foreign investors, due to China's economic downturn (Figure 47). JKS is currently trading at 33.50 USD (as of 18 Dec 2023), down close to 19% from the start of the year, and 44% from its peak of 59.86 USD on 23 January 2023 (Figure 46).


Despite the sustained weakening of China's economic conditions, the solar industry relies more on government funding, subsidies and policies rather than consumer sentiments and willingness to spend. Thus, the solar industry should be more resilient despite China's economic downturn, as compared to consumer industries. Moreover, China will still need to double down on its efforts to steer energy efficiency and clean energy installations, to tackle rising energy consumption and reliance on coal capacity expansion. Therefore, I believe it is unlikely that the prolonged economic downturn will slow down solar installations as the Chinese government is likely to continue its support and push for renewable capacity expansion. Falling prices across the solar value chain should also make solar developers' ROI more attractive and hence lead to increasing demand for modules despite China's slump.
Aside from that, the Chinese government has been actively pushing for new policies to put China on a recovery trajectory, even to the extent of exceeding their fiscal deficit limit of 3% to 3.8% in 4Q 2023 to steer intensified and improved fiscal policies. China's third plenum in 2024, which covers economic policies, will be a key catalyst for sentiment revisions by both consumers and investors. I remain optimistic about China's gradual recovery in the next few years, which should lead to some correction in JKS's share price.
Regarding the issue of solar overcapacity, I feel that the market is discounting JKS's leading position amongst module manufacturers, especially as demand shifts towards N-Type modules where JKS currently leads in terms of manufacturing capacity and technology. While prices of modules will most likely fall, raw materials like polysilicon and PV materials are likely to fall as well, which should allow JKS to preserve its margins or mitigate the fall in module prices to a certain degree. JKS's leading market share in terms of module shipments and tight cost control efforts should allow it to tide through this period of overcapacity as the industry consolidates, where weaker players are pushed out in the short to medium term. After consolidation, my view is that JKS will continue to be one of the leading solar module manufacturers and might even stand to benefit from lesser competition and module price recovery, which should lead to a recovery in profitability.
Cumulative net profit for the first three quarters of 2023 has exceeded historical net profits by a tremendous margin (Figure 48), signaling JKS's strengthening fundamentals of increasing shipments and cost control efforts, yet the company is still plagued by excessive pessimism from temporary macro shocks. In my base case assumptions, I factored in a ~30% reduction in module prices in FY24 and FY25, in light of industry overcapacity, and only factored a slow annual recovery from FY26 onwards. This is a fairly aggressive assumption for the decline in module prices, and while profits will fall for all manufacturers, JKS should see its profits recover gradually in the medium to long term (Figure 49).

Hence, I maintain my conviction for JKS's medium to long term outperformance, and believe that a price correction will happen in the near future.
Valuation
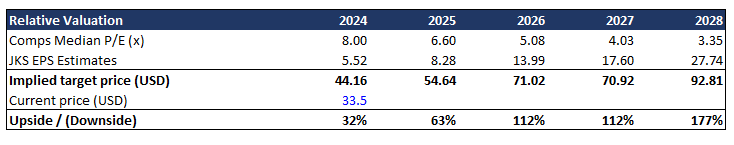
I valued JKS using relative valuation, with the median P/E estimates of my comps set (Figure 50) and my estimates of JKS's future EPS.
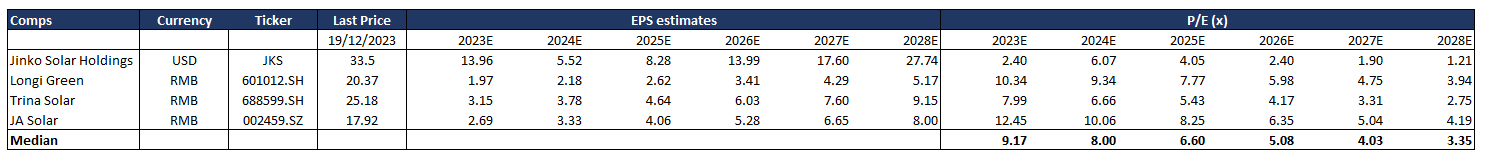
The implied one-year target price is 44.16 USD, which presents a 32% upside from the closing price of 33.5 USD on 19 December 2023
The implied three-year target price is 71.02 USD, which presents a 112% upside from the closing price of 33.5 USD on 19 December 2023.
The implied five-year target price is 92.81 USD, which presents a 177% upside from the closing price of 33.5 USD.
Risks & Mitigations
1) US-China geopolitical tensions:
The volatile geopolitical relationship between China and the US could hinder JKS's module shipments to the US and possibly its allies as well. Furthermore, JKS has a 1 GW manufacturing facility in Florida, where it has recently obtained approval for expansion to seize the profitable US solar market, due to attractive policies and manufacturing tax credits that Chinese firms are still entitled to as long as they have a manufacturing facility that manufactures within the US. However, a strain in the relationship between China and the US could cause this to change and reduce the profitability of JKS's module exports to the US and modules that are manufactured in its Florida plant.
Mitigation: The recent APEC Summit in November 2023, where Chinese President Xi Jinping and US President Joe Biden met face-to-face has proven to be a productive meeting where both leaders have come to several areas of cooperation, such as advancing mutually beneficial cooperation, effective management of disagreements and promoting people-to-people exchanges. This marks a fresh beginning of an improving relationship between the US and China, which could lead to constructive discussions on easing trade sanctions and controls by the US down the road.
2) Heighted solvency risks from increasing CAPEX and debt issuances
As JKS continues to expand its manufacturing capacity with debt, the company will continue to remain significantly leveraged which might increase insolvency risks if shipments fall or from a decline in profit margins (either from falling module prices or cost increases).
Mitigation: JKS's ability to generate operating cash flows increased significantly in 2023 due to greater cost control efforts and module shipments. Its new integrated N-Type base in Shanxi will help maintain its N-Type leadership amongst competitors, which should help defend its market share and provide optimism to future module shipments. Growth CAPEX is also discretionary, which management can assess periodically if market conditions for solar manufacturers were to deteriorate.
Conclusion
Despite temporary macro shocks such as overcapacity in the solar industry and China's economic downturn, I maintain my conviction in JKS's strong and improving fundamentals that will continue to allow the company to tide through this difficult period. While I expect JKS's net profit to decline in FY24 and FY25 from declining module prices, I believe the solar industry's consolidation will prove to be advantageous for JKS in the medium to long term, as prices recover when weaker competitors are forced to exit. Furthermore, JKS currently trades at an attractive LTM P/E multiple of ~3.3x compared to an industry average of ~8-9x, which presents an opportunity to enter into a position, where I anticipate a price correction in the medium term.
References:
https://iea.blob.core.windows.net/assets/d2ee601d-6b1a-4cd2-a0e8-db02dc64332c/SpecialReportonSolarPVGlobalSupplyChains.pdf
https://www.mckinsey.com/industries/automotive-and-assembly/our-insights/enabling-renewable-energy-with-battery-energy-storage-systems
https://www.bloomberg.com/news/articles/2023-05-24/top-solar-firm-warns-excess-capacity-may-bring-wave-of-failures?embedded-checkout=true#xj4y7vzkg
https://www.pv-magazine.com/2023/09/12/impact-of-overcapacity-on-solar-stocks/
https://www.sunsirs.com/uk/prodetail-482.html
https://jinkosolar.eu/wp-content/uploads/061401.pdf
JKS Quarterly Filings, Annual Filings, Investor Presentations
Longi Green, JA Solar, Trina Solar Investor Presentations, Quarterly Filings
HSBC Equity Research
Capital IQ
https://www.solarpowereurope.org/insights/market-outlooks/global-market-outlook-for-solar-power-2023-2027-1
https://jinkosolarcdn.shwebspace.com/uploads/JKM615-635N-78HL4-(V)-F5-EN.pdf
https://jinkosolarcdn.shwebspace.com/uploads/JKM550-570M-72HL4-(V)-F4-EN.pdf
https://jinkosolarcdn.shwebspace.com/uploads/JKM470-490M-7RL3-(V)-F1.1-EN.pdf
https://jinkosolarcdn.shwebspace.com/uploads/Cheetah%20JKM390-410M-72H-(V)-A4-EN-F30.pdf
https://jinkosolarcdn.shwebspace.com/uploads/63e09b78/Suntera%20JKS-3440AL-V2-EN.pdf
https://jinkosolarcdn.shwebspace.com/uploads/JKE344K2HDLA%20-%201500V-EN.pdf
https://jinkosolarcdn.shwebspace.com/uploads/JKS-B51100-GI-A2.pdf
https://www.solarbeglobal.com/topcon-technology-to-dominate-as-costs-fall-below-mono-perc-analysts-say/
https://www.reuters.com/sustainability/climate-energy/chinas-progress-renewables-meet-climate-goals-undermined-by-coal-expansion-2023-11-27/#:~:text=China's%20energy%20bureau%20said%20last,also%20rising%2015.6%25%20to%20404GW.
https://www.bloomberg.com/news/articles/2023-12-08/china-holds-politburo-meeting-on-economy-anti-corruption-moves
https://www.china-briefing.com/news/us-china-relations-in-the-biden-era-a-timeline/
*Do note that all of this is for information only and should not be taken as investment advice. If you should choose to invest in any of the stocks, you do so at your own risk.