Initial Report: Texas Instruments (NASDAQ: TXN), 91.74% 5-yr Potential Upside (Gaius ANG, EIP)
Gaius ANG presents a "BUY" recommendation for Texas Instruments based on the company's unique competitive positioning, top-class capital efficiency and more.


Company Overview
Texas Instruments (TI) is a high-quality analog and embedded semiconductor company with a shareholder-friendly capital allocation strategy, strong pricing power, and a wide moat stemming from its manufacturing scale and customer diversity. The recent share price decline from USD offers a compelling entry point as cyclical headwinds bottom out, setting the stage for earnings recovery.
TI operates primarily through two business segments. Firstly, the Analog segment which includes power management chips and signal chain devices such as data converters and amplifiers. These are used in industrial automation, automotive systems, communications and personal electronics. TI has a competitive edge in this segment, being the defacto industry leader, supplying chips for over 80,000+ analog products the majority of which have long product cycles (~10–15 years).
Next, the Embedded Processing segment which includes microcontrollers, processors and connectivity chips. These are used in control systems in vehicles, industrial machines and IoT devices. This segment is extremely sticky due to custom software and long design cycles that lead to high switching costs for customers.
Thesis
Strong dual drivers due to unique competitive positioning
TI has a large customer base across rapidly growing industries driving revenue and a dominant position as a defacto market leader with a sticky enough customer base that allows it to invest heavily in manufacturing capacity (which improves margins). This allows TI to benefit from the growth of multiple industries while lowering costs.
Revenue Drivers
Texas Instruments is poised to capitalize on the robust growth in the industrial and automotive semiconductor markets, leveraging its leading market share and comprehensive product portfolio to drive sustained revenue growth. TI holds a significant share in the analog semiconductor market, accounting for approximately 3.1% of the global semiconductor market in 2023. This leadership is underpinned by a diverse portfolio of over 80,000 analog products, catering to a wide array of applications with no single customer consisting of more than 10% of TI's revenue. The company has strategically increased its exposure to the industrial and automotive sectors, which combined represented about 70% of its revenue in 2024.
Looking at TI's customer base, it includes:
Automotive Sector (20-25% of revenue)
Advanced Driver-Assistance Systems (ADAS)
Powertrain & EV battery management
Infotainment and cluster systems
Body electronics (e.g., lighting, HVAC)
Industrial Sector (40-45% of revenue)
Factory automation and robotics
Grid infrastructure
Medical devices
Building automation
Personal Electronics (20% of revenue)
Smartphones
Tablets
Wearables
Consumer IoT (e.g., smart speakers, thermostats)
Communications Equipment (10%)
5G infrastructure
Optical networking
Wired/wireless connectivity
At a quick glance, one would notice these industries are all industries that are projected to grow significantly in the next few years. In aggregate, the automotive and industrial sector has experienced a compound annual growth rate (CAGR) of approximately 10% since 2013, with the other industries having significantly higher projected CAGRs.
Another thing to note is that in the with industrial and automotive markets (70% of TI revenue), design cycles can last 6–18 months. Once a chip is validated and embedded in a product (e.g., factory automation equipment or a vehicle ECU), it usually remains for 10–20 years. These chips are often non-substitutable mid-cycle without a full redesign, which is expensive and risky. Switching to a competitor would require re-certification and testing, firmware/software changes, time-to-market delays and risk of system failure or underperformance. This makes switching to a competitor even at the end of a design cycle costly to customers. TI benefits from multi-year recurring revenue streams once a customer design wins — akin to an annuity model.
Cost Drivers
TI also benefits from its manufacturing scale. TI owns and operates most of its manufacturing, including multiple 300mm (12-inch) wafer fabs, which are 40% more cost-efficient than 200mm fabs. Producing on 300mm wafers allows ~2.5x more chips per wafer compared to 200mm wafers (which many competitors still use), but with only modestly higher production cost. This scale advantage is hard to replicate due to the multi-billion-dollar capex required, technical know-how, and long ramp-up timelines.
Furthermore, unlike many fabless peers (who rely on TSMC or other foundries), TI can control its supply chain which is especially crucial during shortages. By controlling the entire value chain — wafer fabrication, assembly, and test, TI reduces reliance on external suppliers and avoids peak-cycle cost inflation in its Analog segment. This allows TI to maintain gross margins in the 60% to 70% range even during downcycles. In Q4 2024, TI maintained a gross margin of 58.14%, above its competitors in the Analog segment including 37.7% for STMicroelectronics, 39.2% for Infineon Technologies and 58.0% for Analog Devices (ADI). It is worth noting that TI's margins are also lowered by its lower margin Embedded Processing segment.
In short, TI is a market leader that has customers in rapidly growing industries and a highly defendable position. TI is also well-positioned to grow with its customer base, having invested heavily in not just manufacturing capacity but also efficiency, enabling them to benefit from the unit economics of scale.
Top-class capital efficiency with concrete strategies to maximize shareholder value
Texas Instruments has consistently had world-class capital efficiency.
TI has an impressive ROIC, significantly higher than its WACC, showcasing exceptional capital efficiency. This is intentional, as per their investor relations:
"The third element of our strategy is efficiency, which we think of as constantly striving for more output for every dollar spent. This is about getting our investments in the most impactful areas to maximize the growth of long-term free cash flow per share; it is not just about optimizing cost cutting to get to the last dollar of expense. We bring this philosophy of efficiency and continuous improvement to all areas of the company, and this focus on efficiency contributes to revenue growth, improved gross margins, disciplined R&D and SG&A expense, free cash flow margins and ultimately to free cash flow per share growth. "
Looking at their historical ROIC reflects this:
2020: 41.27%
2021: 48.9%
2022: 57.23%
2023: 30.31%
2024: 18.66%
While these numbers are lower in recent years, it is largely due to the fact that TI has been front-loading its CAPEX, skewing the ratio. Even with the recent dip taken into consideration, TI's 3-year average ROIC remains higher than its peers at 41.76% compared to TSMC's 28.07% and Qualcomm's 28.87%.
Overreaction to Texas Instrument's Financial Performance
Free Cashflow
TI's share price decline could in part be attributed to its underwhelming free cashflow performance of $1.63 per share. However, investors are overlooking the causes for such performance. TI's lackluster free cashflow performance can largely be attributed to its significant capital expenditures to expand its manufacturing capabilities. TI had front-loaded $5-7bn/year in CAPEX to build out internal 300mm in manufacturing capacity with a CAPEX of $4.8bn in 2024.
The company projects annual CAPEX to be around $5 billion through 2025, with potential reductions to below $5 billion in 2026, depending on market conditions. As TI transitions from a period of elevated capital expenditures to a more normalized CAPEX cycle, the company is expected to enhance its free cash flow and shareholder returns, strengthening its financial position.
TI themselves forecast free cash flow per share to reach between $8 and $12 by 2026 which is significantly higher than its free cashflow per share of $1.63 in 2024. Hence, I believe that investors are overlooking TI's fundamentally strong market position and future prospects due to its present lackluster free cashflow performance, resulting in mispricing and undervaluation, creating an attractive buying opportunity.
Efficiency Ratios
As mentioned earlier, TI's capital efficiency numbers such as ROIC have also been skewed by recent increased capital expenditures aimed at expanding manufacturing capabilities, which may temporarily suppress ROIC but are intended to drive long-term growth. TI's historical averages demonstrate strong capital efficiency, and the company's strategic positioning in the analog semiconductor market supports its potential for future profitability.
Valuation
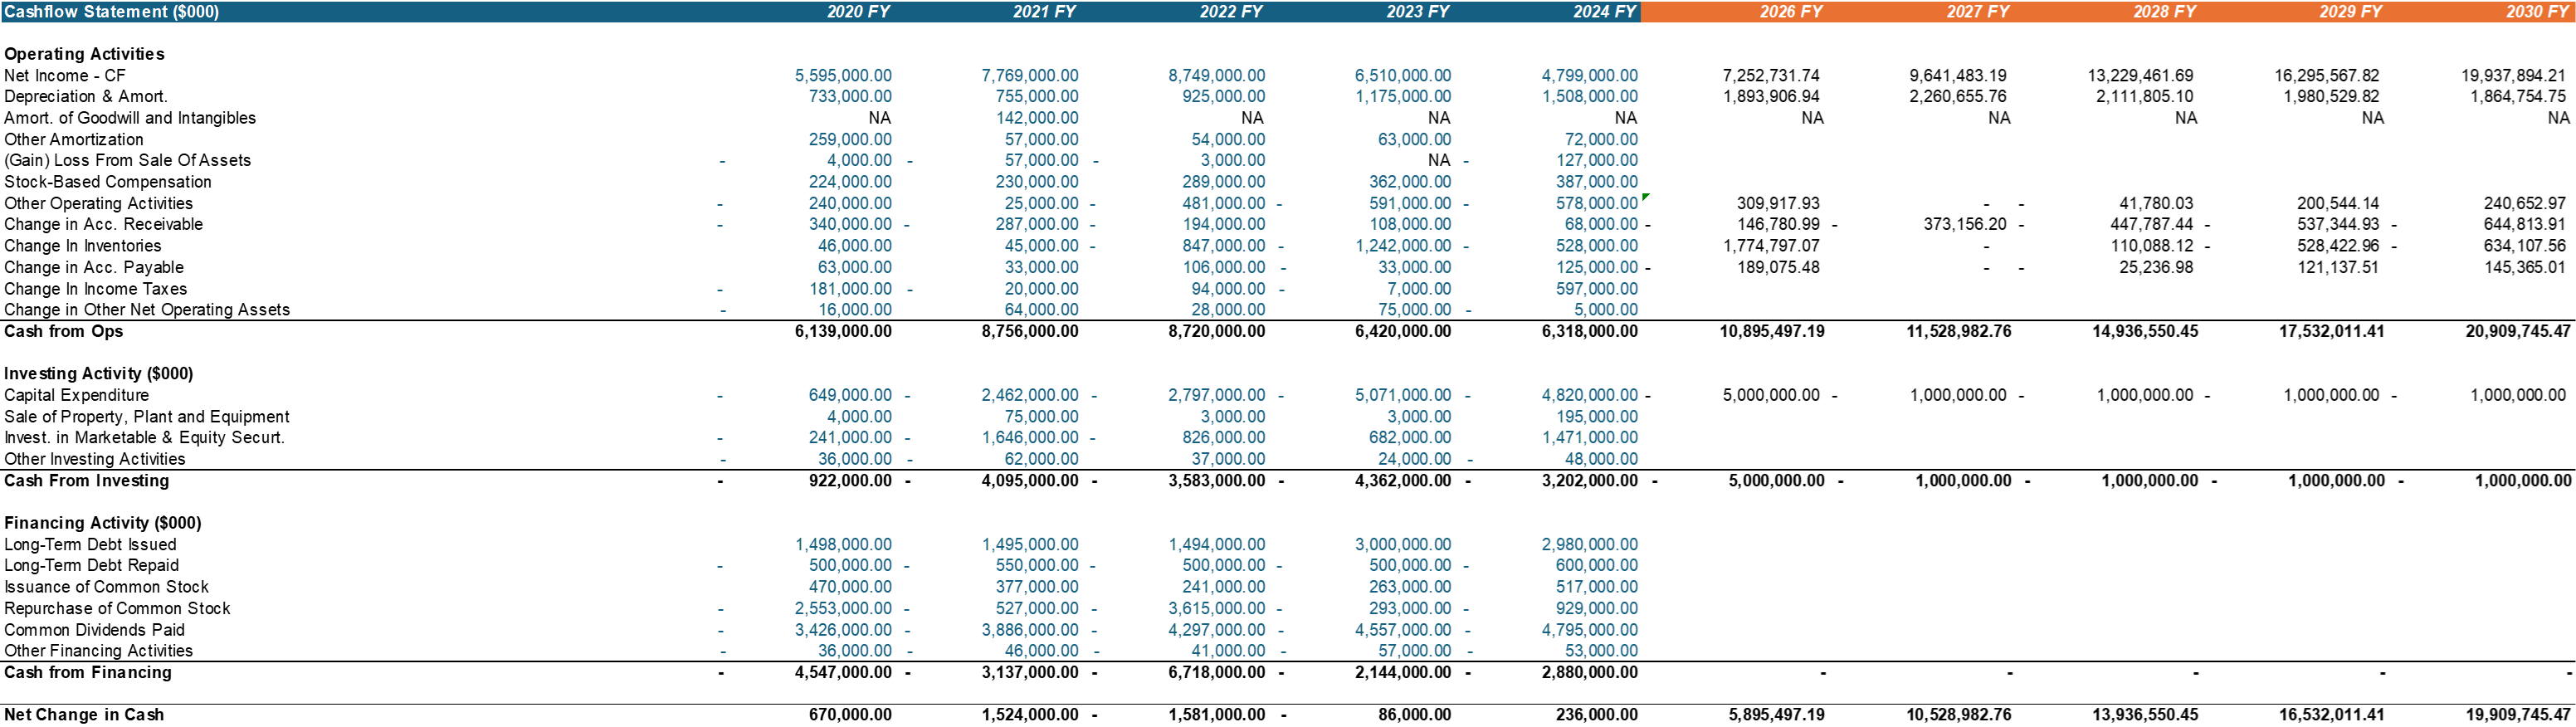
I performed a DCF model for Texas Instruments using a terminal growth rate of 2% and a WACC of 10.35%. I have attached the 3FS model and the DCF in the appendix.
Risk & Mitigation
Cyclicality of the semiconductor industry
TI is exposed to the inherent boom-bust cycles of the semiconductor industry, driven by inventory corrections, fluctuating end-market demand, and macroeconomic conditions. For example, industrial and personal electronics demand softened significantly in 2023–2024 which TI was not exempt from.
However, TI focuses heavily on industrial and automotive markets, which have longer product cycles and more stable demand than consumer-facing segments. Over 70% of TI’s revenue now comes from these less cyclical sectors. The company also maintains a strong balance sheet and cash position, which allows it to navigate downturns without compromising long-term investments.
Execution risk from CAPEX-heavy strategy
TI is currently in the middle of a massive CAPEX cycle (~$5B/year through 2025) as it builds and ramps new 300mm fabs (RFAB2, LFAB). There is risk that demand doesn’t materialize fast enough to absorb this added capacity, hurting returns on invested capital (ROIC).
However, TI has a strong track record of disciplined capital allocation, with 20+ years of consistent FCF generation and shareholder returns. Management has also been transparent and conservative in guiding expectations, with clear visibility on capacity utilization over multi-year horizons.
Conclusion
Overall, I issue a buy recommendation for TI with a target price of $208.56 and believe it is a quality company that will be the backbone of many growing industries over the years to come.
Appendix